纺织学报 ›› 2023, Vol. 44 ›› Issue (10): 60-67.doi: 10.13475/j.fzxb.20220505001

• 纺织工程 • 上一篇    下一篇

基于灰色系统理论的筒子纱卷绕密度测量误差预测

周其洪1,2(), 韩伟龙2, 陈鹏2, 洪巍3, 岑均豪3   

  1. 1.东华大学 纺织装备教育部工程研究中心, 上海 201620
    2.东华大学 机械工程学院, 上海 201620
    3.广州盛原成自动化科技有限公司, 广东 广州 511400
  • 收稿日期:2022-05-16 修回日期:2023-06-18 出版日期:2023-10-15 发布日期:2023-12-07
  • 作者简介:周其洪(1976—),男,教授,博士。主要研究方向为高端纺织装备机电一体化、自动化和智能化及机器人技术。E-mail:zhouqihong@dhu.edu.cn
  • 基金资助:
    国家重点研发计划资助项目(2017YFB1304000)

Prediction of measuring error of bobbin winding density based on grey system theory

ZHOU Qihong1,2(), HAN Weilong2, CHEN Peng2, HONG Wei3, CEN Junhao3   

  1. 1. Engineering Research Center of Advanced Textile Machinery, Ministry of Education, Donghua University, Shanghai 201620, China
    2. College of Mechanical Engineering, Donghua University, Shanghai 201620, China
    3. Guangzhou Seyounth Automation Technology Co., Ltd., Guangzhou, Guangdong 511400, China
  • Received:2022-05-16 Revised:2023-06-18 Published:2023-10-15 Online:2023-12-07

摘要:

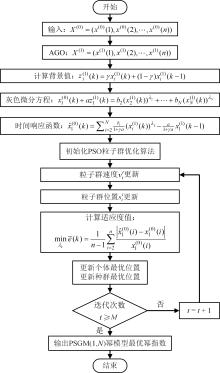
为提高采用激光扫描建模的筒子纱卷绕密度测量方法的测量精度,提出基于灰色系统理论的测量误差预测方法。通过灰色关联分析脉冲频率、采样周期和参数K与测量误差的相关性,获得满足灰色建模要求的建模参数。根据实际建模结构为非线性和建模因子序列中元素变化幅度较大的特点,基于传统多变量GM(1,N)幂模型,引入背景值优化和分数阶累加生成得到优化后的GM(1,N)幂模型,然后结合粒子群优化算法通过幂指数自适应寻优建立PSGM(1,N)幂模型,利用实际采集数据进行建模精度验证。结合测量误差预测值对卷绕密度测量值进行校正,得到更精确的卷绕密度值。结果表明,相比于传统多变量GM(1,N)幂模型,PSGM(1,N)幂模型的卷绕密度测量误差预测精度提升了48.6%,激光扫描建模方法的测量精度提高了11.7%。

关键词: 筒子纱, 卷绕密度, 灰色系统理论, 粒子群优化算法, 背景值优化, 分数阶累加生成, 误差预测

Abstract:

Objective In order to improve the measurement accuracy of the density measurement method for package yarn winding using laser scanning modeling, a prediction method for winding density measurement error based on grey system theory was proposed. By analyzing the changes in measurement errors obtained after adjusting measurement parameters in the actual production process, it can be known that the impact of new measurement parameters on the measurement errors of winding density. Improving the measurement accuracy of non-contact winding density measurement methods is very in line with the current demand for high-quality and efficient production.

Method By analyzing the correlation between pulse frequency, sampling period, and parameter K with measurement error through grey correlation analysis, the modeling parameters meeting the requirements of grey modeling were obtained. According to the characteristics that the actual modeling structure was nonlinear and the elements in the modeling factor sequence changed greatly, the optimized GM (1, N) (grey power model) was obtained by introducing background value optimization and fractional order accumulation based on the traditional multivariable GM (1, N) power model, and then by combining particle swarm optimization algorithm with power index adaptive optimization to establish PSGM (1, N) (particle swarm optimization of grey power model), and by using actual collected data to verify the modeling accuracy.

Results In order to compare and analyze, a classic multivariable GM (1, N) model, a traditional multivariable GM (1, N) power model and a multivariable PSGM (1, N) power model were established to predict the measurement errors in winding density of three different specifications of bobbin yarns. The modeling accuracy and prediction accuracy of these three models were analyzed and compared. In terms of modeling accuracy or model prediction, the optimized multivariate PSGM (1, N) power model had significantly higher modeling and prediction accuracy than the other two models. Combining the predicted measurement error values, the winding density measurement values were corrected to obtain more accurate winding density values. The experimental results showed that compared to the traditional multivariate GM (1, N) power model, the prediction accuracy of the winding density measurement error of the PSGM (1, N) power model was improved by 48.6%, and the measurement accuracy of the laser scanning modeling method was improved by 11.7%.

Conclusion In view of the fact that the actual modeling system is a nonlinear structure and the elements in the influence factor series have a large range of changes in the prediction process of the measurement error of bobbin yarn winding density, a nonlinear multivariable PSGM (1, N) power model optimized by particle swarm optimization algorithm is proposed for modeling and prediction. The use of this optimization model improves the following aspects, where the introduction of multivariable PSGM (1, N) power model can more accurately describe the nonlinear structural characteristics of the actual modeling system, can reduce the modeling error caused by the large change of elements in the influence factor series, and can improve the prediction accuracy within the data series interval. The particle swarm optimization algorithm was used to solve the optimal power exponent in the power model, which not only improves the accuracy of the model, but also improves the modeling efficiency. Particle swarm optimization algorithm has the characteristics of global optimization, which can easily and quickly calculate the optimal value of multiple parameters at the same time. Through practical modeling and analysis of predicted results, it has been proven that this model has good application value in predicting the measurement error of package yarn winding density.

Key words: bobbin yarn, winding density, grey system theory, particle swarm optimization algorithm, background value optimization, fractional cumulative generation, error prediction

中图分类号: 

  • TS19

图1

粒子群算法优化GM(1,N)幂模型"

表1

筒子纱卷绕密度测量误差及相关影响因素"


卷绕密度测量误差/(g·cm-3) 脉冲频
率/kHz
采样周
期/s
参数
K
A B C
1 0.023 581 0.025 438 0.022 343 9.0 0.020 93
2 0.031 211 0.033 668 0.029 572 10.0 0.025 62
3 0.037 742 0.040 714 0.035 761 11.0 0.030 55
4 0.042 301 0.045 632 0.040 081 12.0 0.035 40
5 0.047 355 0.051 084 0.044 869 13.0 0.040 35
6 0.053 081 0.057 261 0.050 295 14.0 0.045 27
7 0.059 869 0.064 583 0.056 726 15.0 0.050 24
8 0.039 868 0.043 007 0.037 775 11.5 0.033 48
9 0.044 776 0.048 301 0.042 425 12.5 0.038 35
10 0.050 889 0.054 896 0.048 217 13.5 0.043 28

表2

灰色关联度值"

筒子纱 灰色关联度值
脉冲频率 采样周期 参数K
A 0.898 4 0.977 8 0.572 2
B 0.901 1 0.983 3 0.576 0
C 0.891 7 0.978 9 0.568 1

表3

3种多变量灰色模型对卷绕密度测量误差的模拟和预测结果"

筒子纱 序号 测量误差/
(g·cm-3)
经典多变量GM(1,N)模型 传统多变量GM(1,N)幂模型 多变量PSGM(1,N)幂模型
模拟值/(g·cm-3) 相对误差/% 模拟值/(g·cm-3) 相对误差/% 模拟值/(g·cm-3) 相对误差/%
A 1 0.023 581 0.023 581 0.00 0.023 581 0.00 0.023 581 0.00
2 0.031 211 -0.005 879 118.84 0.031 845 2.03 0.030 556 2.10
3 0.037 742 0.023 051 38.92 0.040 906 8.38 0.036 871 2.31
4 0.042 301 0.032 072 24.18 0.041 774 1.25 0.041 230 2.53
5 0.047 355 0.041 987 11.33 0.047 321 0.07 0.046 214 2.41
6 0.053 081 0.050 951 4.01 0.051 567 2.85 0.051 755 2.50
7 0.059 869 0.060 963 1.83 0.060 167 0.50 0.058 387 2.48
建模平均相对误差 28.45 2.15 2.05
8 0.039 868 0.031 185 21.78 0.039 719 0.37 0.039 179 1.73
9 0.044 776 0.039 362 12.09 0.040 755 8.98 0.043 626 2.57
10 0.050 889 0.045 255 11.07 0.047 579 6.50 0.048 827 4.05
预测平均相对误差 14.98 5.28 2.78
B 1 0.025 538 0.025 538 0.00 0.025 538 0.00 0.025 538 0.00
2 0.033 868 -0.003 098 109.15 0.034 531 1.96 0.033 644 0.66
3 0.040 914 0.030 165 26.27 0.043 982 7.50 0.040 752 0.39
4 0.045 332 0.041 559 8.32 0.047 040 3.77 0.045 217 0.25
5 0.051 784 0.052 386 1.16 0.052 752 1.87 0.051 731 0.10
6 0.057 961 0.061 596 6.27 0.056 649 2.26 0.057 421 0.93
7 0.064 183 0.070 744 10.22 0.064 140 0.07 0.063 906 0.43
建模平均相对误差 23.06 2.49 0.40
8 0.044 007 0.040 698 7.52 0.044 480 1.07 0.043 367 1.45
9 0.049 301 0.050 766 2.97 0.046 092 6.51 0.048 187 2.26
10 0.055 896 0.061 668 10.33 0.052 455 6.16 0.054 181 3.07
预测平均相对误差 6.94 4.58 2.26
C 1 0.022 443 0.022 443 0.00 0.022 443 0.00 0.022 443 0.00
2 0.029 172 -0.006 545 122.44 0.029 808 2.18 0.029 411 0.82
3 0.035 361 0.020 794 41.20 0.038 425 8.67 0.035 648 0.81
4 0.040 581 0.029 191 26.07 0.041 536 2.35 0.040 531 0.12
5 0.044 369 0.038 462 13.31 0.044 462 0.21 0.045 300 2.10
6 0.050 595 0.046 965 7.17 0.050 234 0.71 0.050 897 0.60
7 0.056 926 0.056 453 0.83 0.057 464 0.95 0.057 350 0.74
建模平均相对误差 30.15 2.16 0.74
8 0.039 275 0.028 271 28.02 0.038 287 2.51 0.038 212 2.71
9 0.044 225 0.036 003 18.59 0.042 010 5.01 0.042 981 2.81
10 0.049 017 0.046 279 5.59 0.045 785 6.59 0.048 133 1.80
预测平均相对误差 17.40 4.70 2.44

表4

卷绕密度测量误差校正结果"

筒子纱 序号 测量值/
(g·cm-3)
校正值/
(g·cm-3)
精度提
高率/%
A 8 0.341 131 0.380 311 10.28
9 0.336 223 0.379 849 11.45
10 0.330 110 0.378 937 12.81
B 8 0.366 992 0.410 359 10.55
9 0.361 698 0.409 885 11.72
10 0.355 103 0.409 285 13.18
C 8 0.321 724 0.359 936 10.58
9 0.316 774 0.359 755 11.90
10 0.311 982 0.360 115 13.33
[1] 高晓艳, 王晓, 张小芳. 毛/涤混纺筒纱染色工艺探讨[J]. 毛纺科技, 2016, 44(6): 41-45.
GAO Xiaoyan, WANG Xiao, ZHANG Xiaofang. Research on dyeing of wool/polyester blended yarn[J]. Wool Textile Journal, 2016, 44(6): 41-45.
[2] 刘幸乐, 姚继明, 侯贺刚, 等. 纱线线密度与染色槽数对靛蓝上染率的影响[J]. 纺织学报, 2016, 37(6): 91-94.
LIU Xingle, YAO Jiming, HOU Hegang, et al. Effect of yarn density and dyeing vat on dye uptake of indigo[J]. Journal of Textile Research, 2016, 37(6): 91-94.
[3] 周伟, 王树根, 孙昌, 等. 羊毛筒子纱染色的渗透性及其匀染性[J]. 毛纺科技, 2020, 48(1): 1-8.
ZHOU Wei, WANG Shugen, SUN Chang, et al. Permeability and levelness control of wool dyeing of wool cheese[J]. Wool Textile Journal, 2020, 48(1): 1-8.
[4] 王元昌, 翁云菊. 筒子卷绕密度的计算[J]. 江南大学学报, 1999(4): 99-103.
WANG Yuanchang, WENG Yunju. The calculation of winding density of cheese[J]. Journal of Jiangnan University, 1999(4): 99-103.
[5] 江珊, 凌文漪, LUBO Hes, 等. 一种新型筒子纱硬度测试方法及其应用[J]. 上海纺织科技, 2015, 43(10): 90-93.
JIANG Shan, LING Wenyi, LUBO Hes, et al. A new testing method of cheese hardness and its applications[J]. Shanghai Textile Science & Technology, 2015, 43(10): 90-93.
[6] 张建新, 李琦. 基于机器视觉的筒子纱密度在线检测系统[J]. 纺织学报, 2020, 41(6): 141-146.
ZHANG Jianxin, LI Qi. Online cheese package yarn density detection system based on machine vision[J]. Journal of Textile Research, 2020, 41(6): 141-146.
[7] 周其洪, 孙宝通, 岑均豪, 等. 采用激光扫描建模的筒子纱卷绕密度测量方法[J]. 纺织学报, 2021, 42(1): 96-102.
ZHOU Qihong, SUN Baotong, CEN Junhao, et al. Measurement method of winding density of cheese package based on laser scanning and modeling[J]. Journal of Textile Research, 2021, 42(1): 96-102.
doi: 10.1177/004051757204200205
[8] LIU S M, ZHAGN G Y. An improved grey model for corrosion prediction of tank bottom[J]. Protection of Metals, 2007, 43(4): 407-412.
doi: 10.1134/S0033173207040157
[9] 章毅, 郭泉, 王建勇. 大数据分析的神经网络方法[J]. 工程科学与技术, 2017, 49(1): 9-18.
ZHANG Yi, GUO Quan, WANG Jianyong. Big data analysis using neural networks[J]. Advanced Engineering Sciences, 2017, 49(1): 9-18.
[10] 潘澔, 高尚. GM(1,1)模型的性质及改进[J]. 山东大学学报: 理学版, 2021, 56(11): 38-42,60.
PAN Hao, GAO Shang. Properties and improvement of GM(1,1) models[J]. Journal of Shandong University: Natural Science, 2021, 56(11): 38-42,60.
[11] REN Jingzheng. GM(1,N) method for the prediction of anaerobic digestion system and sensitivity analysis of influential factors[J]. Bioresource Technology, 2018, 247: 1258-1261.
doi: S0960-8524(17)31848-5 pmid: 29050652
[12] LI Yaping, CHEN Zhen, TAO Liangyan, et al. A novel multi-variable grey prediction model and its application in sino-russian timber trade volume forecasting[J]. Journal of Grey System, 2017, 29(4): 109-121.
[13] 何天隆, 李昊燃, 程远鹏, 等. 基于新型GM(1,N)模型的油气管道腐蚀速率预测[J]. 腐蚀与防护, 2021, 42(10): 79-85.
HE Tianlong, LI Haoran, CHENG Yuanpeng, et al. Prediction of pipeline corrosion rate based on new GM(1,N) Model[J]. Corrosion & Protection, 2021, 42(10): 79-85.
[14] KUO Yiyo, YANG Taho, HUANG Guanwei. The use of grey relational analysis in solving multiple attribute decision-making problems[J]. Computers & Industrial Engineering, 2007, 55(1): 80-93.
doi: 10.1016/j.cie.2007.12.002
[15] ZHOU Qihong, LIN Liqun, CHEN Ge, et al. Prediction and optimization of electrospun polyacrylonitrile fiber diameter based on grey system theory[J]. Materials, 2019, 12(14): 2237-2237.
doi: 10.3390/ma12142237
[1] 马传旭, 张宁, 潘如如. 基于支持向量机的筒子纱纱管品种检测[J]. 纺织学报, 2023, 44(01): 194-200.
[2] 吴乐, 张倩, 杨万然, 徐朝月, 王维冠, 侯曦. 基于增强现实技术的筒子纱印染锁扣机器人运维巡检系统研究[J]. 纺织学报, 2022, 43(09): 34-40.
[3] 周其洪, 孙宝通, 岑均豪, 占齐宸. 采用激光扫描建模的筒子纱卷绕密度测量方法[J]. 纺织学报, 2021, 42(01): 96-102.
[4] 彭来湖, 祝孝裕, 张少民, 胡旭东. 筒子纱包装自动配重方法研究[J]. 纺织学报, 2020, 41(06): 147-152.
[5] 张建新, 李琦. 基于机器视觉的筒子纱密度在线检测系统[J]. 纺织学报, 2020, 41(06): 141-146.
[6] 王文胜, 李天剑, 冉宇辰, 卢影, 黄民. 筒子纱纱笼纱杆的定位检测方法[J]. 纺织学报, 2020, 41(03): 160-167.
[7] 蔡逸超, 周晓, 宋明峰, 牟新刚. 应用多尺度多方向模板卷积的筒子纱缺陷检测[J]. 纺织学报, 2019, 40(04): 152-157.
[8] 牟新刚 蔡逸超 周晓 陈国良. 基于机器视觉的筒子纱缺陷在线检测系统[J]. 纺织学报, 2018, 39(01): 139-145.
[9] 尉苗苗 李岳阳 蒋高明 丛洪莲. 应用最优Gabor滤波器的经编织物疵点检测[J]. 纺织学报, 2016, 37(11): 48-54.
[10] 常丽霞 高卫东 潘如如 刘建立. 灰色GM(1,1)模型在国际春夏女装流行色色相预测中的应用[J]. 纺织学报, 2015, 36(04): 128-133.
[11] 廉志军;潘菊芳;江渊;庄小雄. 筒子纱染色涤纶纤维表面杂质及对策[J]. 纺织学报, 2010, 31(6): 90-94.
[12] 江渊;潘菊芳;廉志军;徐憬. 涤纶纤维筒子染色过程中白色粉末性质的探讨[J]. 纺织学报, 2010, 31(5): 24-29.
[13] 唐蕾;单忠德;吴双峰;郭瑞峰;. 筒子纱染色粉状染料自动配送系统新进展[J]. 纺织学报, 2010, 31(12): 143-147.
Viewed
Full text


Abstract

Cited

  Shared   
  Discussed   
No Suggested Reading articles found!