纺织学报 ›› 2024, Vol. 45 ›› Issue (02): 112-118.doi: 10.13475/j.fzxb.20231008501

• 纺织工程 • 上一篇    下一篇

压力棒牵伸区中的纤维数量分布模型

钱丽莉1, 郁崇文1,2()   

  1. 1.东华大学 纺织学院, 上海 201620
    2.东华大学 纺织面料技术教育部重点实验室, 上海 201620
  • 收稿日期:2023-10-25 修回日期:2023-12-08 出版日期:2024-02-15 发布日期:2024-03-29
  • 通讯作者: 郁崇文(1962—),男,教授。主要研究方向为纤维集合体成形的有关理论与技术、新型纺纱技术及相关理论的研究、天然纤维资源开发利用的研究等。E-mail:yucw@dhu.edu.cn
  • 作者简介:钱丽莉(1996—),女,博士生。主要研究方向为纺纱基础理论。
  • 基金资助:
    国家自然科学基金项目(52173032);上海市现代纺织前沿科学研究基地项目(沪教委科〔2021〕13号);中央高校基本科研业务费东华大学研究生创新基金资助项目(CUSF-DH-D-2023025)

Fiber distribution model in pressure bar drafting zone

QIAN Lili1, YU Chongwen1,2()   

  1. 1. College of Textiles, Donghua University, Shanghai 201620, China
    2. Key Laboratory of Textile Science & Technology, Ministry of Education, Donghua University, Shanghai 201620, China
  • Received:2023-10-25 Revised:2023-12-08 Published:2024-02-15 Online:2024-03-29

摘要:

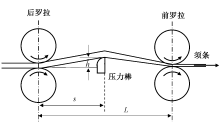
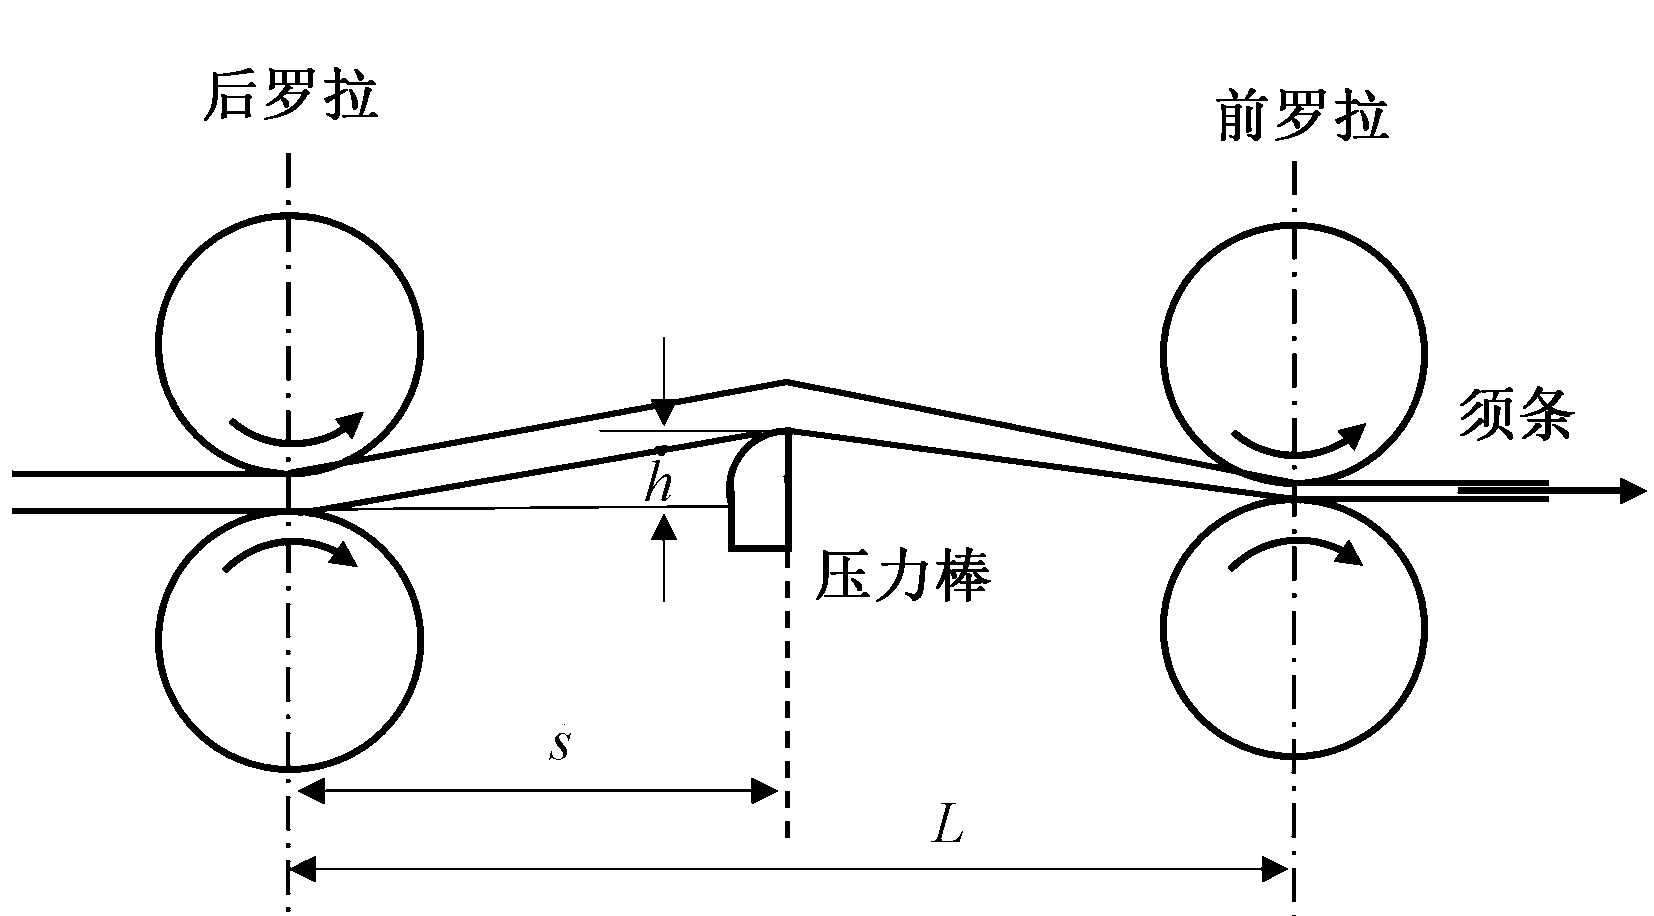
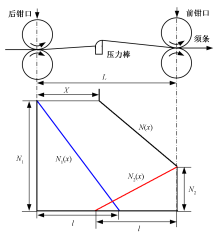
牵伸区中纤维的运动状态受与其接触纤维状态的影响,为研究牵伸区中纤维的运动状态,对上托式压力棒牵伸区中各类纤维的数量分布进行了研究。分析了牵伸区中各类纤维的理论分布,测量了牵伸区中的各类纤维数量分布,简化了纤维数量分布曲线。再通过均匀设计,测试了不同牵伸参数下的变细曲线,建立了变细曲线与牵伸参数之间的回归方程,最终得到了牵伸区中的纤维数量分布模型。结果表明:牵伸区中各类纤维的数量分布受牵伸倍数、罗拉握持距、纤维长度、压力棒位置等牵伸参数的显著影响,纤维的数量分布可基于总纤维、前纤维和后纤维的数量分布得到。回归方程的平均拟合误差在7%以内,所建立的纤维数量分布模型适用于涤纶和粘胶纤维。

关键词: 压力棒牵伸, 变细曲线, 均匀设计, 牵伸工艺, 拟合回归, 纤维数量分布模型, 并条机

Abstract:

Objective Drafting is a key process in spinning and has attracted much attention due to the recent development of virtual spinning technology. The drafting process is essentially a process by which the fibers redistribute and rearrange in sliver or strand. To accurately predict the fiber distribution and better control the fiber movement during drafting, the distribution of fibers in the drafting zone was investigated by analyzing the changes in the weight of fibers along the length direction of sliver or strand.

Method In order to analyze the fiber distribution in the drafting zone theoretically, cutting and weighing method was used to obtain the attenuation curve and the distribution of front-roller and back-roller fibers, from which the distribution of floating fibers, fast-floating fibers, slow-floating fibers, fast-moving fibers, and slow-moving fibers from the theory were expected to be derived. in addition, attenuation curves under different draft parameters were obtained based on the uniform design and a fiber distribution model in the drafting zone.

Results The fiber distribution in the drafting zone with a pressure bar was analyzed and measured. It was shown that in the drafting zone, the distribution of the total fiber, the front-roller fiber, and the back-roller fiber was needed to confirm the distribution of the floating fiber, the fast-floating fiber, the slow-floating fiber, the fast-moving fiber, and the slow-moving fiber. The distribution curves were simplified. For simplicity, man-made fibers of equal length were discussed in this paper. The distribution curves of the front-roller and back-roller fibers in the form of diagonal lines, and the thinning curve could be expressed as a folded line. According to the simplified distribution curves, it was only necessary to determine the attenuation curve.

The experiment was carried out by uniform design, the attenuation curve under different drafting parameters was tested based on the cut-off weighing method, and the regression equation between the turning point of the thinning curve and the drafting parameters such as the drafting multiple, the roller grip distance, the fiber length, the position of the pressure bar was established, and the coefficient of determination R2 was 0.97. The fitting error within the fitted group was 5.66%. The measured results showed that the larger the drafting multiple, the farther away roller-setting, the shorter the fiber length, and the higher the height of the pressure bar, the farther the turning point of the thinning curve was from the back nip. And the position of the pressure bar in the drafting zone did not have a significant effect on the turning point. To verify the accuracy and applicability of the regression equation, polyester and viscose slivers in the drafting zone were cut and weighed respectively, then the tested results were used to identified for comparison with the calculated values, and the average fitting errors were 5.44% and 6.70%. A calculation model of the fiber distribution in the drafting zone was finally derived based on the above analysis and measurement, which can effectively predict the fiber distribution, according to drafting multiples, roller-setting, fiber length, and height of the pressure bar.

Conclusion The accuracy of the model is illustrated by comparing the measured and predicted values, and the model allows the determination of fiber distribution based on drafting parameters, which can effectively predict the fiber distribution, reduce the number of related measurements, and provide a basis for the study of fiber arrangement and movement. The distribution of fibers in the drafting zone is the main factor affecting the evenness of the strip. Mastering the fiber distribution not only predicts the alignment of fibers after drafting but also improves the quality of sliver formation. The fiber distribution equations presented in this study can provide a basis for drafting process simulations and smart textiles.

Key words: pressure bar drafting, attenuation curve, uniform design, drafting process, fitting regression, fiber distribution model, draw frame

中图分类号: 

  • TS101.1

图1

上托式压力棒牵伸装置示意图"

图2

牵伸区中纤维数量分布示意图"

图3

牵伸区中纤维数量分布实测图"

图4

牵伸区纤维数量分布的简化曲线"

表1

均匀设计方案与测试结果"

序号 E L/
mm
l/
mm
s/
mm
h/
mm
X/
mm
1 2.8 66 32 24 4 34.10
2 7.6 68 32 28 6 31.88
3 4.4 68 38 32 6 29.79
4 1.2 62 51 24 2 14.26
5 7.6 60 38 32 2 15.39
6 4.4 66 51 32 2 12.64
7 1.2 68 32 32 2 39.00
8 2.8 68 38 24 2 22.27
9 4.4 64 38 24 4 25.96
10 7.6 66 51 32 4 12.09
11 2.8 60 51 32 4 9.31
12 4.4 60 32 28 4 26.85
13 6.0 66 32 28 2 26.71
14 7.6 62 32 24 4 25.99
15 1.2 60 32 24 6 29.93
16 2.8 64 38 28 2 25.70
17 6.0 62 38 32 6 25.76
18 4.4 64 51 24 6 16.04
19 6.0 68 51 24 4 16.15
20 6.0 60 51 28 6 7.69
21 2.8 62 51 28 6 11.90
22 7.6 64 51 28 2 8.15
23 4.4 62 32 28 2 25.22
24 7.6 66 38 24 6 28.12
25 6.0 60 38 24 2 16.38
26 1.2 66 38 28 6 29.54
27 1.2 68 51 28 4 18.42
28 2.8 64 32 32 6 35.65
29 6.0 64 32 32 4 29.91
30 1.2 62 38 32 4 26.45

表2

回归方程的偏相关系数检验表"

偏相关系数 t检验值 p
r(X, x1)=-0.865 0 8.444 4 0.000 1
r(X, x2)=0.462 4 2.555 0 0.017 1
r(X, x3)=-0.978 4 23.172 6 0.000 1
r(X, x 2 2)=-0.442 0 2.414 3 0.023 4
r(X, x1x5)=0.757 3 5.680 5 0.000 1

表3

拟合组的拟合误差"

序号 观测值/mm 拟合值/mm 拟合误差/%
1 34.10 34.01 0.27
2 31.88 33.47 5.00
3 29.79 29.29 1.67
4 14.26 13.67 4.12
5 15.39 14.03 8.86
6 12.64 12.78 1.14
7 39.00 35.25 9.62
8 22.27 27.46 23.31
9 25.96 25.68 1.06
10 12.09 11.90 1.59
11 9.31 9.66 3.71
12 26.85 25.99 3.21
13 26.71 28.39 6.28
14 25.99 26.22 0.87
15 29.93 29.42 1.69
16 25.70 25.85 0.60
17 25.76 24.78 3.81
18 16.04 15.52 3.22
19 16.15 13.68 15.28
20 7.69 9.50 23.50
21 11.90 14.05 18.05
22 8.15 7.17 11.99
23 25.22 27.10 7.47
24 28.12 27.52 2.14
25 16.38 16.20 1.10
26 29.54 30.39 2.86
27 18.42 18.02 2.19
28 35.65 34.02 4.58
29 29.91 29.85 0.19
30 26.45 26.38 0.26

表4

涤纶检验组的拟合误差"

序号 E L/
mm
l/
mm
s/
mm
h/
mm
观测值/
mm
拟合值/
mm
拟合误差/
%
1 3.7 60.0 32 24 4 27.58 25.78 6.53
2 3.7 60.0 51 24 4 9.49 7.99 15.76
3 4.0 65.0 38 24 5 26.01 26.72 2.73
4 5.2 65.0 32 28 4 32.38 30.34 6.29
5 5.2 62.5 38 32 6 25.19 24.86 1.29
6 6.0 62.5 51 28 4 9.61 9.60 0.06
平均误差 5.44

表5

粘胶纤维检验组的拟合误差"

序号 E L/
mm
l/
mm
s/
mm
h/
mm
观测值/
mm
拟合值/
mm
拟合误差/
%
1 1.2 62.5 51 24 4 13.65 13.93 2.05
2 3.7 62.5 51 32 6 11.14 13.36 19.96
3 4.0 65.0 38 32 2 22.40 23.98 7.07
4 4.0 65.0 38 24 5 25.31 26.72 5.57
5 5.2 65.0 51 28 3 11.43 11.37 0.51
6 7.0 62.5 38 28 2 18.62 17.68 5.05
平均误差 6.70
[1] 管幼平, 李增润, 李杨, 等. 面向智能制造的数控纺纱技术及数字化纱线产品研发[J]. 纺织导报, 2019(3):42-47.
GUAN Youping, LI Zengrun, LI Yang, et al. Intelligent manufacturing oriented CNC spinning technology and digital yarn product development[J]. China Textile Leader, 2019(3):42-47.
[2] JOHNSON N, 黄润发. 牵伸过程的计算机模拟[J]. 国外纺织技术, 1982(11):36-39.
JOHNSON N, HUANG Runfa. Computer simulation of drafting process[J]. Textile Technology Overseas, 1982(11):36-39.
[3] HANNAH M. Theory of high drafting[J]. Journal of the Textile Institute, 1950(41):57-126.
[4] CAVANEY B, FOSTER G A R. Some observation on the drafting forces of rayon-staple slivers[J]. Journal of the Textile Institute Transactions, 1954, 45(5):390-404.
[5] SIDDIQUI Q, YU C. Drafting force measurement and its relation with break draft and short term sliver irregula-rity[J]. Indian Journal of Fibre & Textile Research, 2014, 39(4):358-363.
[6] 冯清国, 任家智, 贾国欣, 等. 棉纺细纱机后区牵伸力的在线检测[J]. 纺织学报, 2014, 35(10):36-39.
FENG Qingguo, REN Jiazhi, JIA Guoxin, et al. On-line detection on drafting force of back zone with cotton spinning frame[J]. Journal of Textile Research, 2014, 35(10):36-39.
[7] TAYLOR D S. The velocity of floating fibers during drafting of worsted slivers[J]. Journal of the Textile Institute Transactions, 1958:233-236.
[8] 崔月敏, 程隆棣, 和杉杉, 等. 基于循环迭代法的牵伸区纤维运动仿真模拟[J]. 纺织学报, 2023, 44(2):76-82.
CUI Yuemin, CHENG Longdi, HE Shanshan, et al. Simulation of fiber motion in drafting zone based on cyclic interative method[J]. Journal of Textile Research, 2023, 44(2):76-82.
[9] TAYLOR D S. Some observations on the movement of fibres during drafting[J]. Journal of the Textile Institute Transactions, 1954, 45(4):310-322.
[10] MCVITTIE J, BARR A. Fibre motion in roller and apron drafting[J]. Journal of the Textile Institute Proceedings, 1960, 51(4):147-156.
[11] 李瑛慧, 谢春萍, 刘新金. 基于纤维变速点分布实验的成纱条干不匀研究[J]. 纺织学报, 2016, 37(8):32-36,58.
LI Yinghui, XIE Chunping, LIU Xinjin. Study on yarn unevenness based on experiment of fibers accelerated-point distribution[J]. Journal of Textile Research, 2016, 37(8):32-36,58.
[12] SHEN Y, N I J, YANG J, YU C. Study on the testing of the accelerated point of the floating fiber in the roller drafting process with an improved method[J]. Textile Research Journal, 2022, 92(1/2):168-179.
doi: 10.1177/00405175211030881
[13] 朱进忠, 苏玉恒, 严广松. 纤维须丛拉细曲线的测试研究[J]. 中国纤检, 2010(11):52-53.
ZHU Jinzhong, SU Yuheng, YAN Guangsong. The experimental research of the attenuation curve of fiber beard[J]. China Fiber Inspection, 2010(11):52-53.
[14] 郭明华, 刘新金. 基于切断称重法的细纱机牵伸区内纤维变速点分布研究[J]. 纺织学报, 2021, 42(8):71-75.
GUO Minghua, LIU Xinjin. Investigation on distribution of fiber accelerated points in drafting zone of ring spinner based on cut-weighing method[J]. Journal of Textile Research, 2021, 42(8):71-75.
[15] SUN N, LIU M. Study on the accelerated-point distribution of floating fibers in the drafting zone[J]. Textile Research Journal, 2022, 92(17/18):3193-3203.
doi: 10.1177/00405175211059204
[16] 范航, 许多, 唐建东, 等. 后区压力棒表观特征对纤维成纱性能的影响[J]. 棉纺织技术, 2021, 49(2):19-23.
FAN Hang, XU Duo, TANG Jiandong, et al. Influence of back pressure bar apparent characteristic on fiber spinning property[J]. Cotton Textile Technology, 2021, 49(2):19-23.
[17] FUJINO K, SHIMOTSUMA Y, SAKAGUCHI K. A study of apron-drafting: part II: a theoretical analysis of floating-fibre control[J]. The Journal of the Textile Institute, 1977, 68:60-68.
doi: 10.1080/00405007708631469
[18] 庄楚强, 何春雄. 应用数理统计基础[M]. 第3版. 广州: 华南理工大学出版社, 2006:296-305.
ZHUANG Chuqiang, HE Chunxiong. Fundamentals of applied mathematical statistics[M]. 3rd ed. Guangzhou: Applied Mathematical Statistics, 2006:296-305.
[19] 卢裕臻. CuAg-Ni-Ti-Zr高温钎料的研究及其与钨基粉末合金的连接[D]. 长春: 吉林大学, 2022:62-68.
LU Yuzhen. Study on CuAg-Ni-Ti-Zr high temperature filler metal and its joining with tungsten-based powder metallurgy alloy[D]. Changchun: Jilin University, 2022:62-68.
[1] 胡宝继, 张巧玲, 王旭. 聚乙二醇改性热塑性环氧树脂及其可纺性[J]. 纺织学报, 2023, 44(02): 63-68.
[2] 段金娟, 宣艾祺, 袁博, 李娜娜. 基于感性意象的并条机造型设计[J]. 纺织学报, 2022, 43(04): 160-166.
[3] 王青 王贯超. FA322B并条机牵伸机构主牵伸区部分参数的优化设计[J]. 纺织学报, 2017, 38(08): 139-143.
[4] 高志娟 郁崇文. 并条机后区牵伸倍数的模拟设计[J]. 纺织学报, 2017, 38(04): 39-45.
[5] 宋栓军. 并条机牵伸罗拉同步性检测方法[J]. 纺织学报, 2016, 37(09): 123-128.
[6] 英迪;汪军;田承泰. 牵伸力与并条条子质量的关系[J]. 纺织学报, 2010, 31(3): 111-115.
[7] 李宏亮;周武能;王新厚;. 并条机自调匀整双开环控制系统[J]. 纺织学报, 2010, 31(2): 106-109.
[8] 曹煜彤;高向华;胡祖明;刘兆峰. 基于均匀设计优化PPTA纤维的热处理工艺[J]. 纺织学报, 2010, 31(12): 1-3.
[9] 谢永奇;高红霞;余建祖;赵然. JWF-A型并条机吸风系统气流流场的数值仿真[J]. 纺织学报, 2009, 30(9): 109-114.
[10] 陈剑飞;许晓桢;徐战彬. 并条机罗拉齿面冷轧成形技术[J]. 纺织学报, 2005, 26(5): 37-39.
[11] 姚杰;叶国铭. 新型开环自调匀整装置的分析与设计[J]. 纺织学报, 2005, 26(3): 44-45.
Viewed
Full text


Abstract

Cited

  Shared   
  Discussed   
No Suggested Reading articles found!