纺织学报 ›› 2023, Vol. 44 ›› Issue (04): 38-45.doi: 10.13475/j.fzxb.20211100808

• 纤维材料 • 上一篇    下一篇

生丝传统检验与电子检测的碳足迹核算与评价

许建梅1,2(), 潘璐璐3, 伍冬平2,4, 卞幸儿5, 胡亿丰1, 戴佳洋1, 王雨静1   

  1. 1.苏州大学 纺织与服装工程学院, 江苏 苏州 215021
    2.苏州大学 江苏省纺织印染节能减排与清洁生产工程中心, 江苏 苏州 215123
    3.杭州海关技术中心, 浙江 杭州 310012
    4.浙江丝绸科技有限公司, 浙江 杭州 311305
    5.浙江凯喜雅国际股份有限公司, 浙江 杭州 310004
  • 收稿日期:2021-11-02 修回日期:2022-05-13 出版日期:2023-04-15 发布日期:2023-05-12
  • 作者简介:许建梅(1976—),女,副教授,博士。主要研究方向为生丝检验、医用生物材料。E-mail:xujianmei@suda.edu.cn
  • 基金资助:
    中国纺织工业联合会科技指导性项目(2021015);江苏省纺织印染节能减排与清洁生产工程中心开放课题资助项目(Q811580722);中国工程院战略研究与咨询项目(2022-XY-19)

Quantification and evaluation of carbon footprint based on traditional test and electronic test of raw silk

XU Jianmei1,2(), PAN Lulu3, WU Dongping2,4, BIAN Xing'er5, HU Yifeng1, DAI Jiayang1, WANG Yujing1   

  1. 1. College of Textile and Clothing Engineering, Soochow University, Suzhou, Jiangsu 215021, China
    2. Jiangsu Engineering Research Center of Textile Dyeing and Printing for Energy Conservation, Discharge Reduction and Cleaner Production, Soochow University, Suzhou, Jiangsu 215123, China
    3. Technical Center of Hangzhou Customs District, Hangzhou, Zhejiang 310012, China
    4. Zhejiang Silk Technology Co., Ltd., Hangzhou, Zhejiang 311305, China
    5. Zhejiang Cathaya International Co., Ltd., Hangzhou, Zhejiang 310004, China
  • Received:2021-11-02 Revised:2022-05-13 Published:2023-04-15 Online:2023-05-12

摘要:

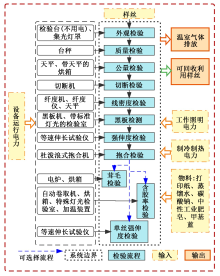
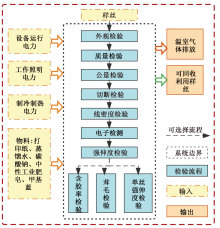
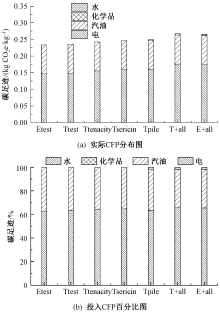
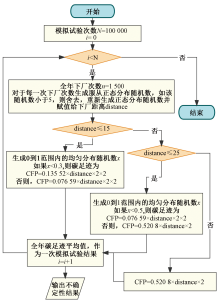
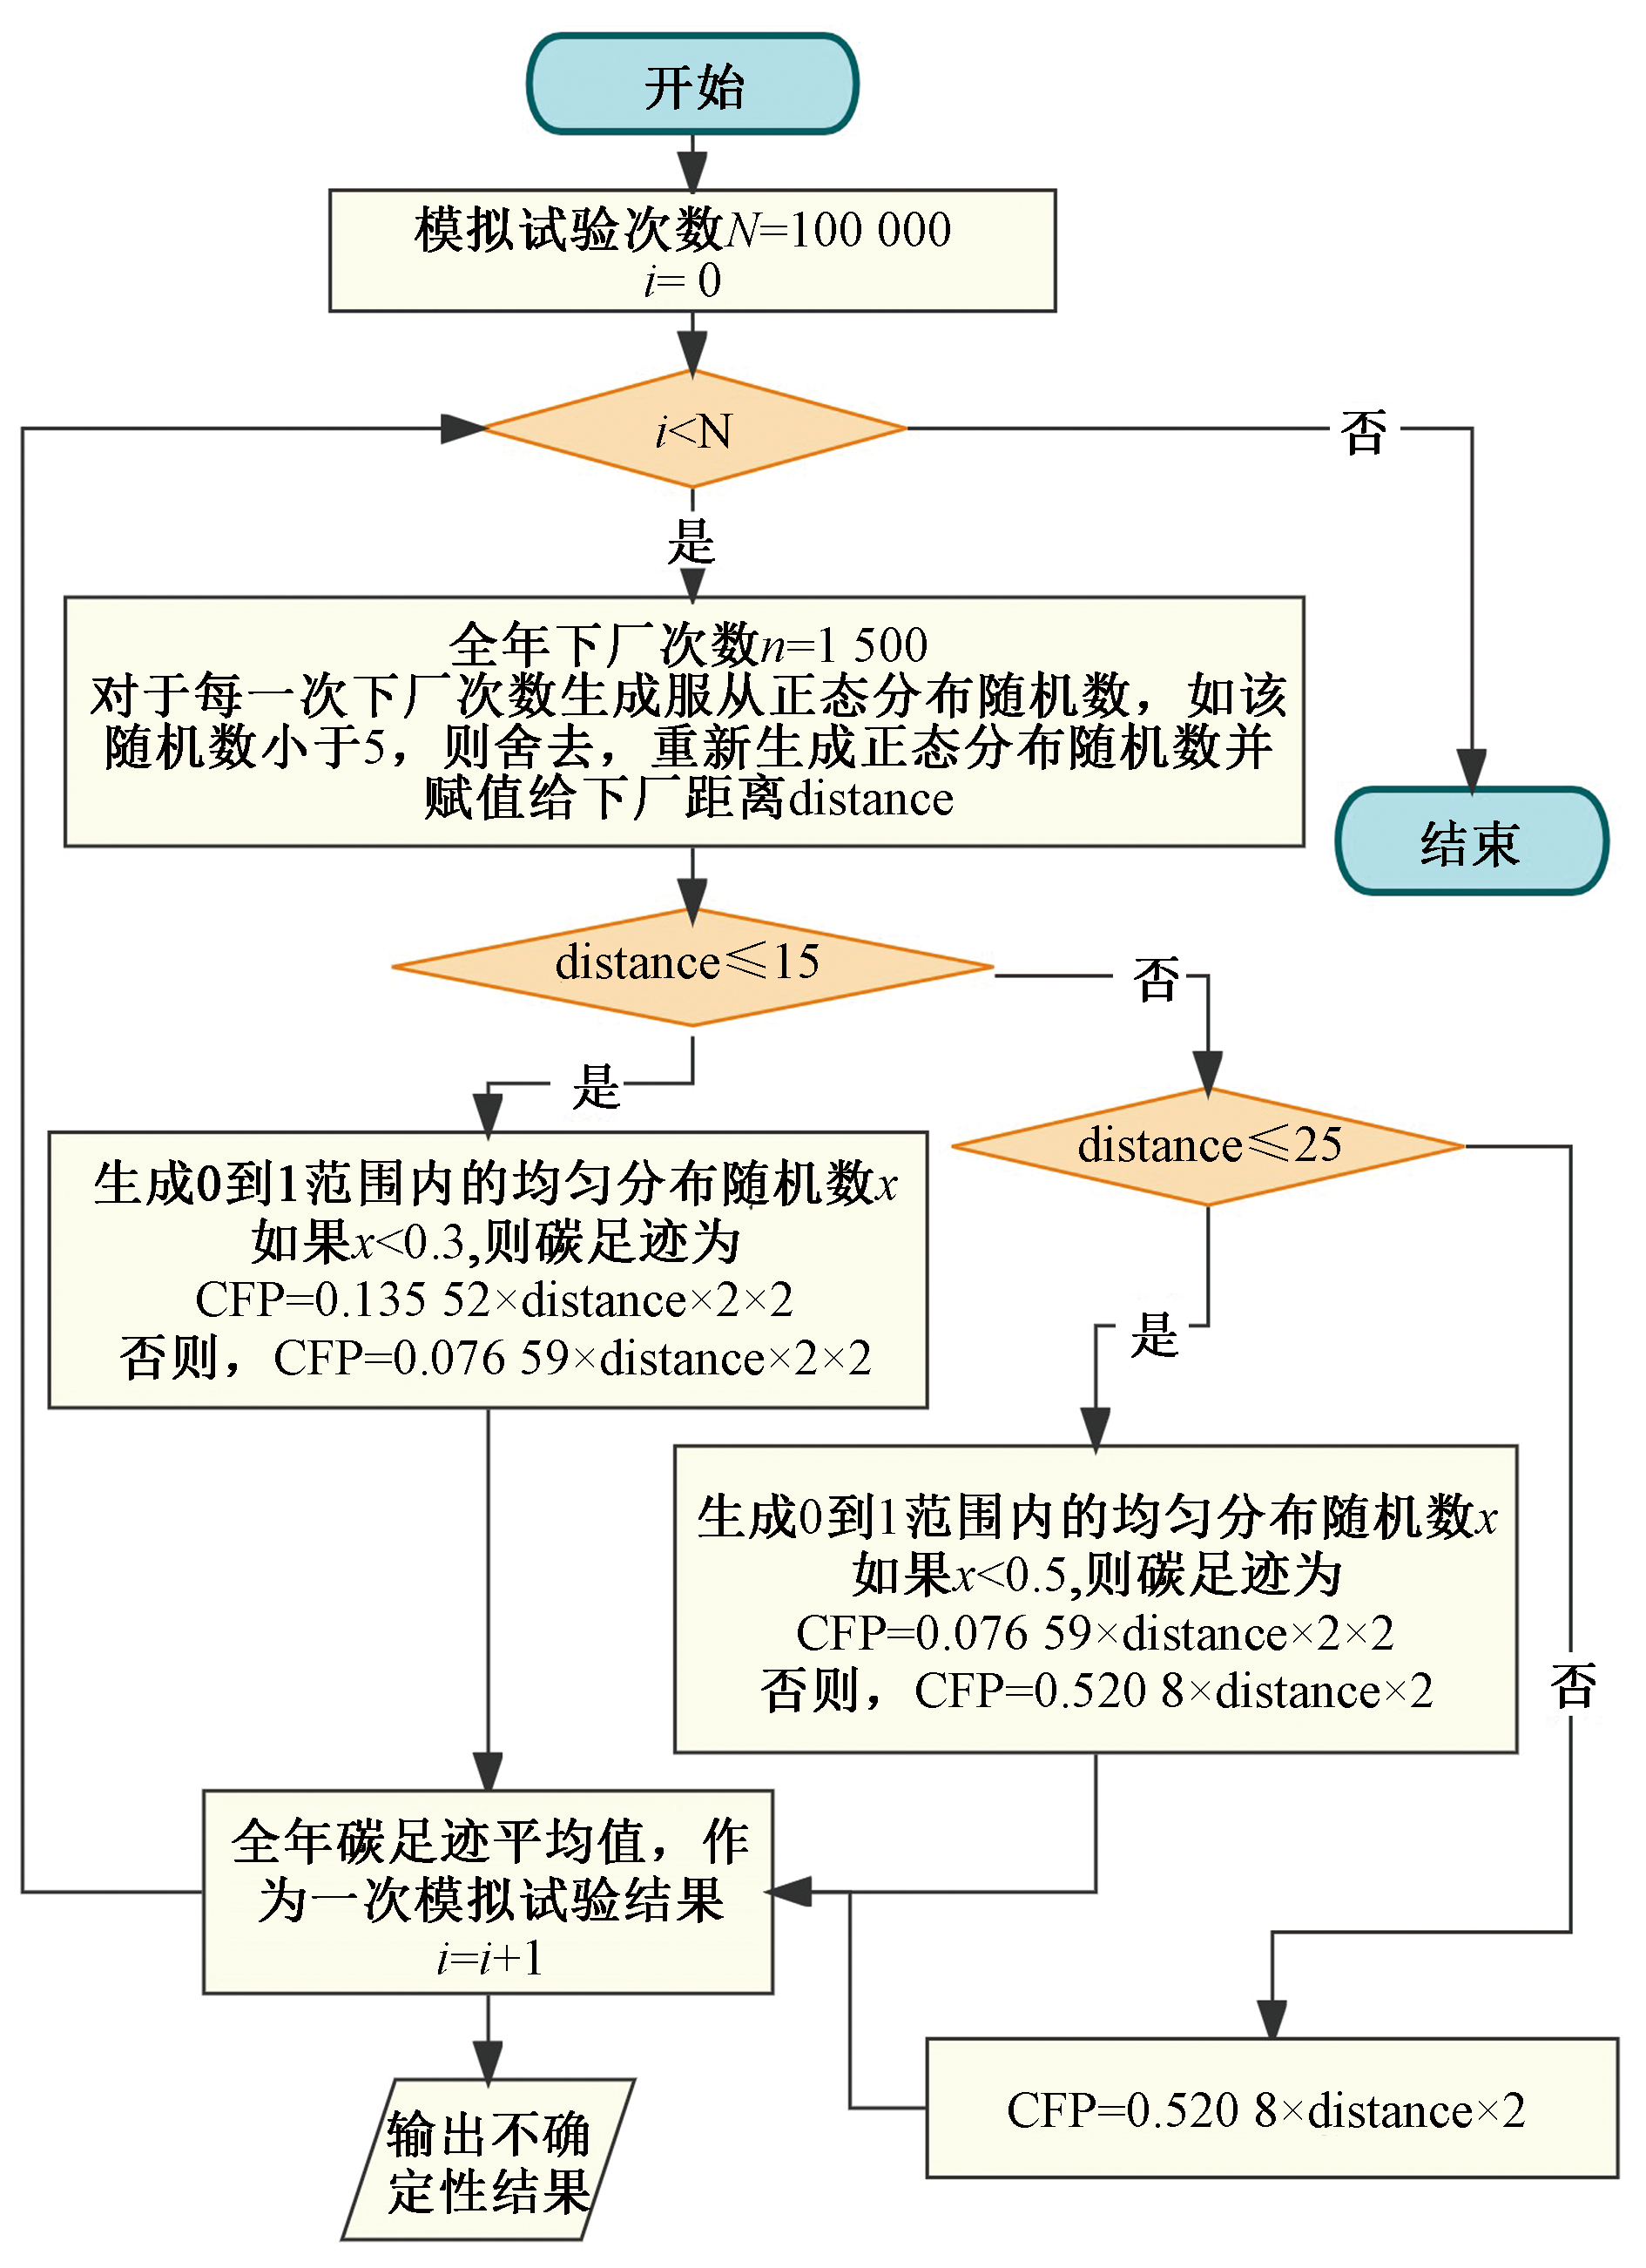
为响应国家实现双碳目标,对生丝检验阶段进行了初级活动数据采集,并采用生命周期评价(LCA)方法对传统检验和电子检测2种检验过程中的碳足迹进行核算。结果表明:生丝传统检验方法和电子检测方法的碳足迹分别为0.235 5 及0.233 6 kgCO2e/kg,温室气体(GHG)排放主要来自恒温恒湿间的用电;单个检验项目中切断检验的GHG排放最高,外观检验次之,二者的GHG排放分别占传统检测方法的53.07%、36.88%;3个委托检验项目中茸毛检验的GHG排放最高,为0.014 5 kgCO2e/kg,含胶率检验与单丝强伸度检验的排放均较低;不确定性分析表明每批丝的总质量对总排放的影响在3.95%以内(95%置信区间)。建立的生丝检验过程中初级活动数据的调研与分配方法,碳足迹核算以及不确定性分析的方法,可为丝绸行业进行碳足迹核算提供数据与方法参考。

关键词: 生丝检验, 碳足迹, 核算, 生命周期评价, 温室气体

Abstract:

Objective In response to our national goal of "achieving a carbon peak by 2030, and carbon neutrality by 2060", the silk industry urgently needs to carry out life cycle assessment, carry out carbon footprint accounting, and guide silk enterprises to conduct energy-saving and emission reduction green production. Although raw silk inspection is a small part of the entire silk product industry chain, it is also an important part. Research on the carbon footprint assessment of this stage is also necessary.
Method The life cycle assessment (LCA) method under the framework of ISO14067 and ISO14040/44 was used to calculate and compare the carbon footprint of the traditional and electronic inspection of raw silk. The primary activity data including the electricity, material and other additive inputs were collected in the most representative silk inspection agency in China. The Monte Carlo method was used to assess the uncertainty of the accounting results through computer simulation.
Results The system boundaries of traditional and electronic raw silk tests were established as shown in Fig. 1 and Fig. 2, where the main inputs for the two testing methods were almost the same with only slight differences in unit processes. The primary activity data of each unit process are collected and recorded, as shown in Tab. 1. The GHG emission factors of different energy and material inputs were listed(Tab. 2). The carbon footprint (CFP) was calculated by multiplying the quantity of the material input and GHG emission factor of the material. The CFP distribution of raw silk inspections consisting of different unit processes, as well as corresponding CFP percentages of different inputs for different inspections(Fig. 3). The results indicate that the proportion of electricity consumption was the largest, followed by gasoline used for transportation, and the electricity consumption was mainly due to the operation of standard atmosphere maintained in the test room. CFP quantification result shows that there are no big differences between the CFPs of the electronic test and traditional inspection, which are 0.233 6 and 0.235 5 kgCO2e/kg respectively. The difference between the two test methods is mainly the difference between the seriplane test, the cohesion test and the electronic test. The total test time and electricity consumption are basically the same, so the GHG emissions of the two methods are also similar. Greenhouse gas (GHG) emissions mainly come from electricity consumption for maintaining the standard atmosphere in the inspection room. As the winding machine is huge compared with other test devices, the winding tests occupied a larger space in the room with a standard atmosphere, which contributed to 53.07% of the total emissions of the traditional raw silk inspection. Among the three entrusted inspection items, the GHG emissions of the pile test are the highest, reaching 0.014 5 kgCO2e/kg, and the sericin content test is 0.010 8 kgCO2e/kg, while the emissions of monofilament tenacity test are small enough to be neglected. The uncertainty analysis shows that the impact of the total weight of each batch of silk on the total emissions is within 3.95% (95% confidence interval). In raw silk inspection, the two unit processes of appearance inspection and weight inspection are conducted on the whole batch of raw silk. Thus the inspectors need to go to the factory to conduct the inspection. Thus, the distance between the inspection center and the factory varies from miles to hundreds of miles. The GHG emissions of the inspector transportation are estimated according to the average distance, and the uncertainty of this estimation was computed using the Monte Carlo method through Visual C++ programming. The uncertainty percentages of this estimation to the total CFPs of the two test methods are 0.41%, and 0.4%.
Conclusion The calculation results showed that the two test methods yielded almost the same results in GHG emissions, and the GHG emissions during raw silk inspection were largely from electricity consumption. Therefore, effective ways to reduce GHG emissions seem to improve the space utilization rate of the standard atmosphere room, increase the inspection batches and control the cooling or heating temperature of the air conditioner. This study established the estimation and allocation methods of primary activity data collected, CFP accounting and the uncertainty analysis method in the process of raw silk inspection, which provided data and a method reference for CFP accounting in the silk industry.

Key words: raw silk inspection, carbon footprint, quantification, life cycle assessment, greenhouse gas

中图分类号: 

  • TS147

图1

生丝传统检验方法的生命周期框架"

图2

生丝电子检测方法的生命周期框架"

表1

生丝传统检验与电子检测中各单元过程的生命周期清单"

检验指标 照明用电/
(kW·h)
设备用电/
(kW·h)
空调用电/
(kW·h)
恒温恒湿/
(kW·h)
汽油体
积/L
碳酸钠质
量/kg
中性皂质
量/kg
甲基蓝质
量/kg
水体积/
L
外观检验 0.036 8
质量检验 0.036
公量检验 0.120 3.000 0.597
切断检验 0.480 2.500 109.800
线密度检验 0.036 0.125 8.036
黑板检验 0.108 0.090 0.300
强伸度检验 0.006 0.100 1.339
抱合检验 0.027 0.030 7.393
含胶率检验 0.270 7.650 1.792 0.006 18
单丝强伸度检验 0.024 0.500 5.357
茸毛检验 0.480 8.320 0.246 0.3 0.024 240
电子检测 0.324 2.750 3.214

表2

生丝检验中能源、物料投入的GHG排放因子"

各类投入 单位 排放因子 来源
kg CO2e/(kW·h) 0.664 7 国家公布数据
汽油 kg CO2e/kg 6.510 0 团体标准
碳酸钠 kg CO2e/kg 1.870 0 文献[10]
甲基蓝 kg CO2e/£ 0.500 0 2012 Defra/DECC
kg CO2e/m3 1.040 0 2011 Defra/DECC

图3

生丝传统检验与电子检测碳足迹核算结果"

图4

下厂检验引起的碳足迹核算不确定性的程序流程图"

[1] XU J M, ZHOU Y, NIU J T, et al. Statistical characteristics for the defect occurrence of raw silk[J]. Textile Research Journal, 2020, 90(3/4): 302-312.
doi: 10.1177/0040517519865040
[2] XU J M, WU D P, ZHOU Y, et al. Raw silk quality index comparison between electronic tester and seriplane test system[J]. Journal of Fiber Bioengineering Informatics, 2014, 7: 339-348.
doi: 10.3993/jfbi
[3] 蒋婷, 陈泽勇, 姚婷婷, 等. 香云纱面料碳足迹评价[J]. 印染, 2012, 38(8): 39-41.
JIANG Ting, CHEN Zeyong, YAO Tingting, et al. Product carbon footprint (PCF) assessment of gambiered Canton silk[J]. China Dyeing & Finishing, 2012, 38(8): 39-41.
[4] 韩晓怡. 真丝绸产品的清洁生产与生态设计[J]. 纺织导报, 2006(4): 34-36.
HAN Xiaoyi. Clean procution and biodesign of the pure silk products[J]. China Textile Leader, 2006(4): 34-36.
[5] GIACOMIN A M, GARCIA J R J B, ZONATTI W F, et al. Brazilian silk production: economic and sustainability aspects[J]. Procedia Engineering, 2017, 200: 89-95.
doi: 10.1016/j.proeng.2017.07.014
[6] GIACOMIN A M, GARCIA JR J B, ZONATTI W F, et al. Silk industry and carbon footprint mitigation[J]. IOP Conference Series: Material Science and Engineering, 2017, 254(19): 1-6.
[7] LI Y, WANG Y, HE Q, et al. Calculation and evaluation of carbon footprint in mulberry production: a case of Haining in China[J]. International Journal of Environmental Research and Public Health, 2020, 17(4): 1339.
doi: 10.3390/ijerph17041339
[8] ASTUDILLO M F, THALWITZ G, VOLLRATH F. Life cycle assessment of Indian silk[J]. Journal of Cleaner Production, 2014, 81: 158-167.
doi: 10.1016/j.jclepro.2014.06.007
[9] CHU Z Q, WU D P, BIAN X E, et al. Life cycle modularization for silk products and their carbon footprint quantification model[C]// LI Y. The 14th Textile Bioengineering and Informatics Symposium Proceedings, Rube: TBIS. 2021: 175-182.
[10] 李昕. 纺织服装产品工业碳足迹核算中若干关键问题的研究[D]. 上海: 东华大学, 2014: 78.
LI Xin. Study on several crucial issues about industrial carbon footprint of textile and apparel products[D]. Shanghai: Donghua University, 2014: 78.
[11] 潘璐璐, 董锁拽, 蒋小葵, 等. 浙江省丝类进出口商品质量与贸易现状分析[J]. 丝绸, 2021, 58(2): 72-78.
PAN Lulu, DONG Suozhuai, JIANG Xiaokui, et al. Analysis on quality and current international trade of silk commodities in Zhejiang province[J]. Journal of Silk, 2021, 58(2): 72-78.
[1] 夏明, 李沛儒, 丁蓉. 基于要素匹配的连衣裙成本快速核算方法[J]. 纺织学报, 2022, 43(03): 146-152.
[2] 王来力 吴雄英 丁雪梅 李一. 纺织品及服装的工业水足迹核算与评价[J]. 纺织学报, 2017, 38(09): 162-167.
[3] 王来力 丁雪梅 吴雄英 . 纺织产品碳足迹研究进展[J]. 纺织学报, 2013, 34(6): 113-119.
[4] 杨自平, 张建春, 张华, 张晓霞, 高志强. 基于PAS2050规范的大麻纤维产品碳足迹测量分析[J]. 纺织学报, 2012, 33(8): 140-144.
Viewed
Full text


Abstract

Cited

  Shared   
  Discussed   
No Suggested Reading articles found!