纺织学报 ›› 2019, Vol. 40 ›› Issue (05): 124-130.doi: 10.13475/j.fzxb.20180607907
周捷1( ), 李健1, 马秋瑞1, 黄晓杰2
ZHOU Jie1(), LI Jian1, MA Qiurui1, HUANG Xiaojie2
摘要:
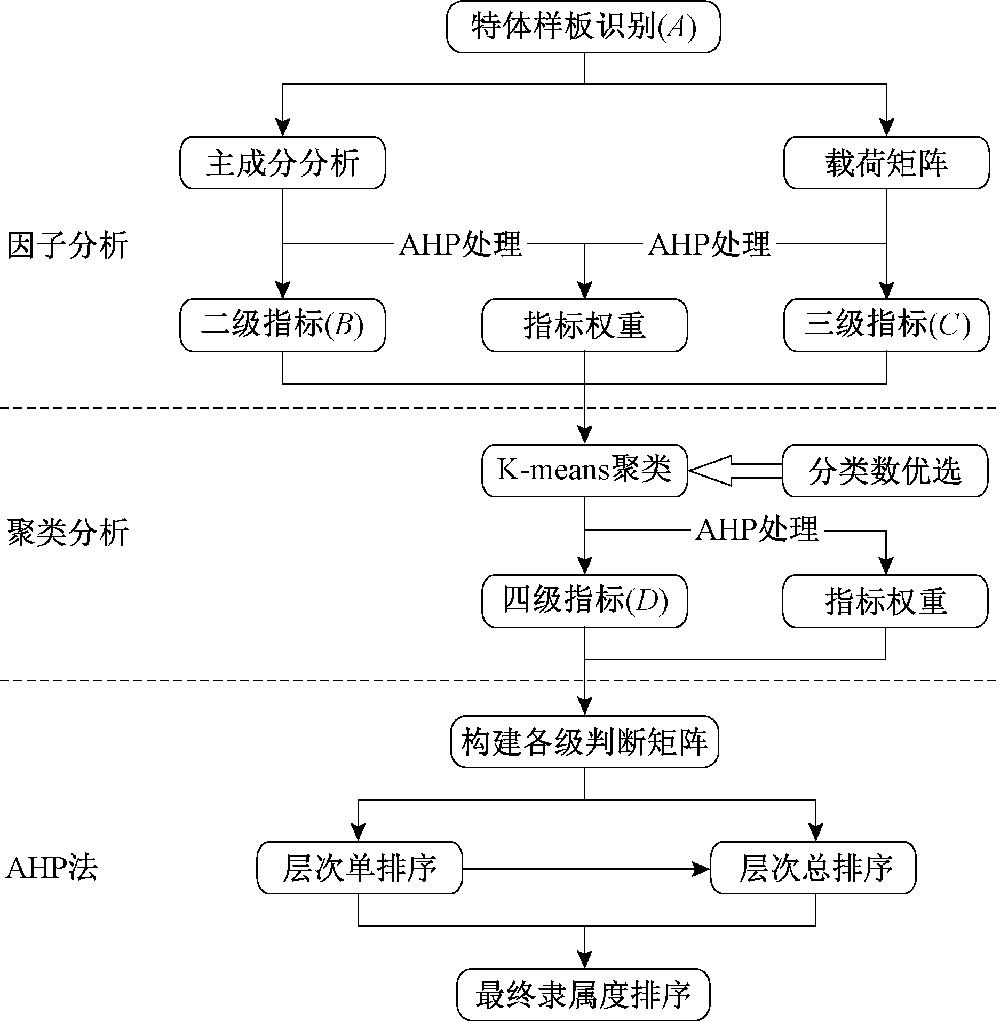
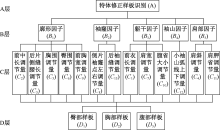
针对传统层次分析法的缺陷,提出结合因子分析、聚类分析的改进层次分析方法,应用到特体样板识别中。首先,通过因子分析确定各级指标的影响因素及其权重系数。然后,采用K-means聚类分析将特体样板聚为臀部、胸部和腹部等3类典型样板。最后,运用层次分析法确定各指标的权重,构建了包括6个二级指标、13个三级指标、3个四级指标的特体样板递阶层次结构模型。随机选取3个样本进行实证研究,以因子分析中提取的5个主成分为聚类指标,以K-means方法进行聚类,采用特体样板递阶层次结构模型识别被测样本与臀部、胸部、腹部样板的隶属度。结果表明,该方法可有效地表征特体样板的变异程度并识别所属的样板类别。
中图分类号:
| [1] | CORONA E, ALENYA G, GABAS A, et al. Active garment recognition and target grasping point detection using deep learning[J]. Pattern Recognition, 2018,74(2):629-641. |
| [2] | APEAGYEI P R. Application of 3D body scanning technology to human measurement for clothing fit[J]. International Journal of Digital Content Technology & Its Applications, 2010,4(7):58-68. |
| [3] | MENG Y, MOK P Y, JIN X. Computer aided clothing pattern design with 3D editing and pattern alteration[J]. Computer Aided Design, 2012,44(8):721-734. |
| [4] | 冀艳波, 张睿, 应柏安. 男西装工业生产用服装样板改进分析[J]. 西安工程大学学报, 2008,22(5):565-568. |
| JI Yanbo, ZHANG Rui, YING Boan. Analysis of the improved industry production pattern of the man suit[J]. Journal of Xi'an Polytechnic University, 2008,22(5):565-568. | |
| [5] | 张伶俐, 张皋鹏. 应用MatLab的服装纸样参数化平面制版[J]. 纺织学报, 2019,40(1):130-135. |
| ZHANG Linli, ZHANG Gaopeng. Parametric flat pattern design for clothing based on MatLab[J]. Journal of Textile Research, 2019,40(1):130-135. | |
| [6] | 朱伟明, 谢琴, 彭卉. 男西服数字化智能化量身定制系统研发[J]. 纺织学报, 2017,38(04):151-157. |
| ZHU Weiming, XIE Qin, PENG Hui. Digitalize and intelligentize customization system of men's suit[J]. Journal of Textile Research, 2017,38(04):151-157. | |
| [7] | 彭磊, 谢红, 邹奇芝. 基于量身定制特体女装原型样板的生成[J]. 纺织学报, 2011,32(4):101-105. |
| PENG Lei, XIE Hong, ZOU Qizhi. Generation of women's basic patterns of special body forms based on made to measure[J]. Journal of Textile Research, 2011,32(4):101-105. | |
| [8] | LIU K, WANG J, KAMALHA E, et al. Construction of a prediction model for body dimensions used in garment pattern making based on anthropometric data learning[J]. The Journal of The Textile Institute, 2017,108(12):2107-2114. |
| [9] | 刘为敏, 谢红. BP神经网络下的智能化合体服装样板生成[J]. 纺织学报, 2018,39(7):116-121. |
| LIU Weimin, XIE Hong. Generation of intelligent fitting pattern based on BP neural network[J]. Journal of Textile Research, 2018,39(7):116-121. | |
| [10] | PENG S, LIU Z W, The comprehensive assessment of power quality based on attribute recognition theory and AHP algorithm[J]. Advanced Materials Research, 2014, 1044-1045:515-522. |
| [11] | PUNIASINDHU S, NEHRAV, LUTHRA S. Recognition and prioritization of challenges in growth of solar energy using analytical hierarchy process: Indian outlook[J]. Energy, 2016,100(4):332-348. |
| [12] | ZHAO J, JIN J, ZHU J, et al. Water resources risk assessment model based on the subjective and objective Combination weighting methods[J]. Water Resources Management, 2016,30(9):3027-3042. |
| [13] | SAATY T L, VARGASL G. An innovative orders-of-magnitude approach to AHP-based mutli-criteria decision making: prioritizing divergent intangible humane acts[J]. European Journal of Operational Research, 2011,214(3):703-715. |
| [14] | 郑唯唯, 凌晓静, 杨萍. 基于层次分析法的多指标灰靶决策模型[J]. 纺织高校基础科学学报, 2013(4):463-467. |
| ZHENG Weiwei, LING Xiaojing, YANG Ping. The multi-attribute grey target decision-making model based on analytic hierarchy process[J]. Basic Sciences Journal of Textile Universities, 2013 (4):463-467. | |
| [15] | 陈明月, 杨青, 高琼琼. 层次分析法在本科教学评估中的应用研究[J]. 西安工程大学学报, 2010,24(1):106-110. |
| CHEN Mingyue, YANG Qing, GAO Qiongqiong. Application of AHP in the undergraduate education evaluate[J]. Journal of Xi'an Polytechnic University, 2010,24(1):106-110. | |
| [16] | OKABE K, KUROKAWA T. Silhouette analysis and categorization of body shape changes in Japanese girls during periods of growth[J]. Japanese Journal of Ergonomics, 2010,41(1):17-23. |
| [17] | 齐静, 李毅, 张欣. 我国西部地区青年男性体型描述与体型分类研究[J]. 纺织学报, 2010,31(5):107-111. |
| QI Jing, LI Yi, ZHANG Xin. Description and classification of young men's body type in the west China[J]. Journal of Textile Research, 2010,31(5):107-111. | |
| [18] | 庹武, 郑攀, 常亭亭, 等. 基于层次分析法的服装裁剪分床影响因素[J]. 纺织学报, 2013,34(4):148-152. |
| TUO Wu, ZHENG Pan, CHANG Tingting, et al. Analysis of factors affecting cutting scheme based on analytical hierarchy process[J]. Journal of Textile Research, 2013,34(4):148-152. | |
| [19] | ZHANG J, WANG C M, LIU L, et al. Investigation of carbon dioxide emission in China by primary component analysis[J]. Science of the Total Environment, 2014,472(2):239-247. |
| [20] | WANG R W, YAN J L, WU X Y, et al. Automatic Identification of lyocell and cotton fibers using cluster Analysis[J]. Textile Research Journal, 2010,80(13):1330-1334. |
| [1] | 邢丽娟, 刘新金, 苏旭中, 曹秀明. 应用灰色聚类方法评价特种动物纤维综合物理性能[J]. 纺织学报, 2019, 40(01): 26-31. |
| [2] | 高广明 朱江晖 许丽慧 孙莉 谷芬芬. C2C环境下服装零售感知服务质量综合评价模型[J]. 纺织学报, 2018, 39(08): 164-170. |
| [3] | 王军 李晓久 潘力 姚彤 于佐君. 东北地区青年女性腰臀部体型特征与分类[J]. 纺织学报, 2018, 39(04): 106-110. |
| [4] | 杜玉红 杨程午 蒋秀明 刘仁杰 蔡文超. 应用聚类神经网络的异纤检测多类光源优化设计[J]. 纺织学报, 2017, 38(10): 104-112. |
| [5] | 王晓予 向军 潘如如 梁惠娥 高卫东. 服饰刺绣图案的自动提取与色块分割[J]. 纺织学报, 2017, 38(09): 120-126. |
| [6] | 夏凤勤 毋戈 谢昊洋 钟跃崎. 基于人体纵截面特征曲线的体型分类[J]. 纺织学报, 2017, 38(06): 86-91. |
| [7] | 高广明 朱江晖 谷芬芬. 服装卖场顾客感知服务质量评价体系与模型[J]. 纺织学报, 2017, 38(06): 136-142. |
| [8] | 朱江晖 朱俊莉. 服装品牌形象影响因素及其权重分布[J]. 纺织学报, 2016, 37(4): 148-152. |
| [9] | 黄帅 张毅 周志华. 采用因子分析法的服用织物电磁屏蔽性能影响因素分析[J]. 纺织学报, 2016, 37(2): 149-154. |
| [10] | 马崇启 蔡薇琦 阚永葭. 酚醛纤维织物热湿舒适性的灰色聚类分析[J]. 纺织学报, 2016, 37(12): 29-32. |
| [11] | 高融 王玲 杨以雄. 服装线上零售渠道消费者决策机制[J]. 纺织学报, 2016, 37(12): 146-152. |
| [12] | 蔡薇琦 马崇启 阚永葭 杨金莲 李君丽 . 灰色聚类分析在织物热学性能评价中的应用[J]. 纺织学报, 2016, 37(11): 64-67. |
| [13] | 周小溪 梁惠娥 陈潇潇 董稚雅 秦潇璇. 春夏季衬衫用色织面料材质的感觉评价[J]. 纺织学报, 2016, 37(08): 59-64. |
| [14] | 金娟凤 庞程方 陈伟杰 叶晓露 邹奉元. 青年男性肩点横截面曲线及其体型细分[J]. 纺织学报, 2016, 37(08): 100-106. |
| [15] | 周小溪 梁惠娥. 基于感性意象的服装面料设计效果评价[J]. 纺织学报, 2015, 36(04): 60-64. |
|
||
 京公网安备11010502044800号