纺织学报 ›› 2024, Vol. 45 ›› Issue (03): 36-43.doi: 10.13475/j.fzxb.20221006501

• 纤维材料 • 上一篇    下一篇

基于机器视觉的棉花颜色检测方法

白恩龙1, 张周强1,2(), 郭忠超1, 昝杰1   

  1. 1.西安工程大学 机电工程学院, 陕西 西安 710600
    2.西安工程大学 陕西省功能性服装面料重点实验室, 陕西 西安 710600
  • 收稿日期:2022-12-31 修回日期:2023-05-23 出版日期:2024-03-15 发布日期:2024-04-15
  • 通讯作者: 张周强
  • 作者简介:白恩龙(1998—),男,硕士生。主要研究方向为机器视觉。
  • 基金资助:
    国家自然科学基金青年科学基金项目(61701384);陕西省教育厅重点科学研究计划项目(20JS051);西安工程大学柯桥纺织产业创新研究院项目(19KQYB03);陕西省自然科学基础研究计划项目(2023-JC-YB-288)

Cotton color detection method based on machine vision

BAI Enlong1, ZHANG Zhouqiang1,2(), GUO Zhongchao1, ZAN Jie1   

  1. 1. School of Mechanical and Electrical Engineering, Xi'an Polytechnic University, Xi'an, Shaanxi 710600, China
    2. Shaanxi Provincial Key Laboratory of Functional Garment Fabrics, Xi'an Polytechnic University, Xi'an, Shaanxi 710600, China
  • Received:2022-12-31 Revised:2023-05-23 Published:2024-03-15 Online:2024-04-15
  • Contact: ZHANG Zhouqiang

摘要:

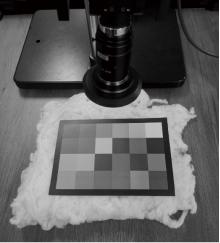
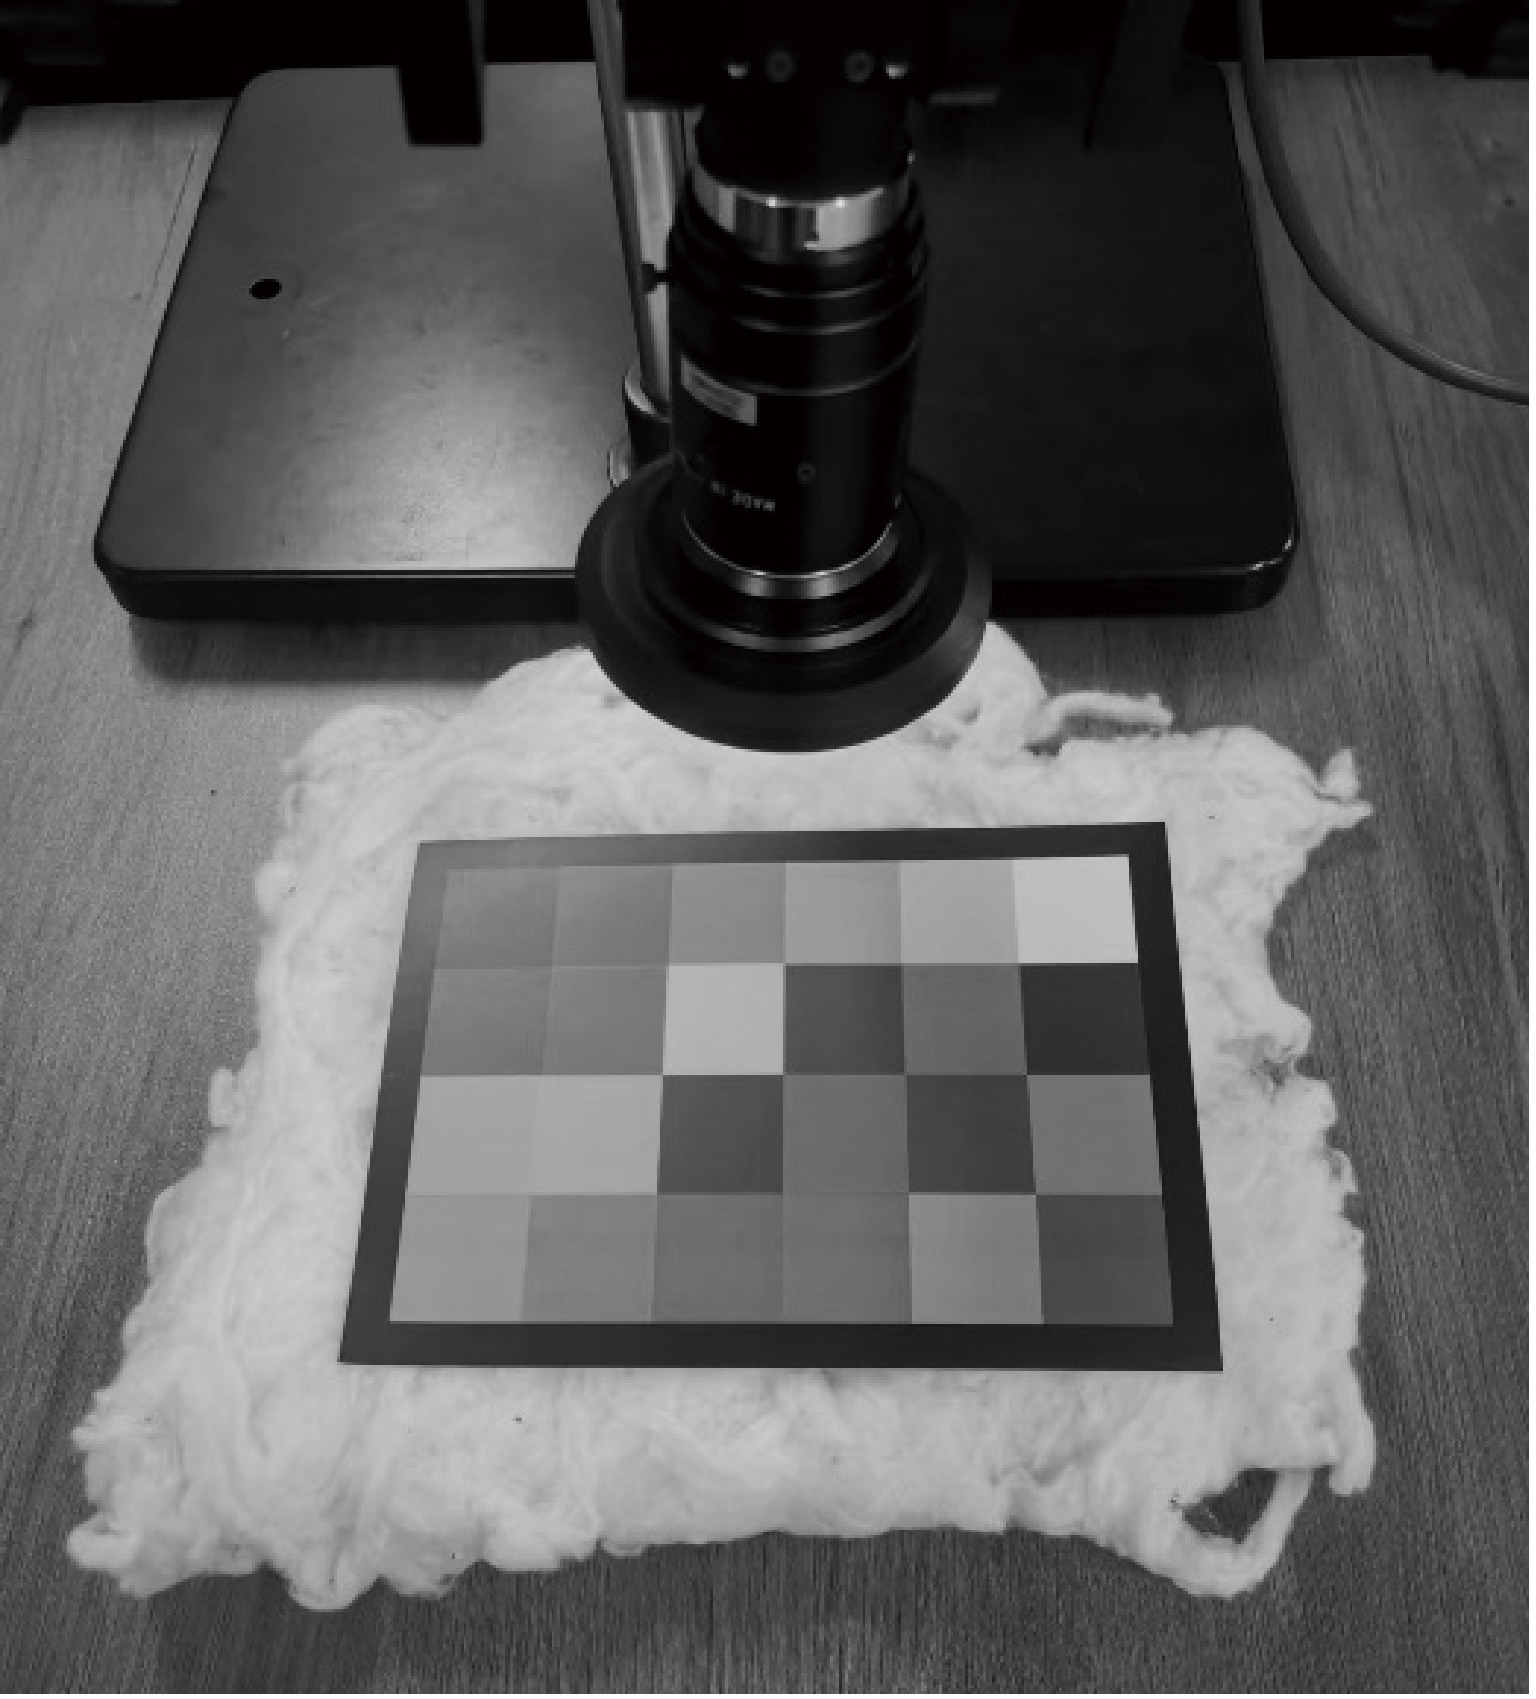
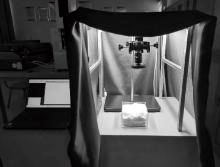
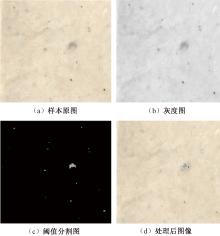
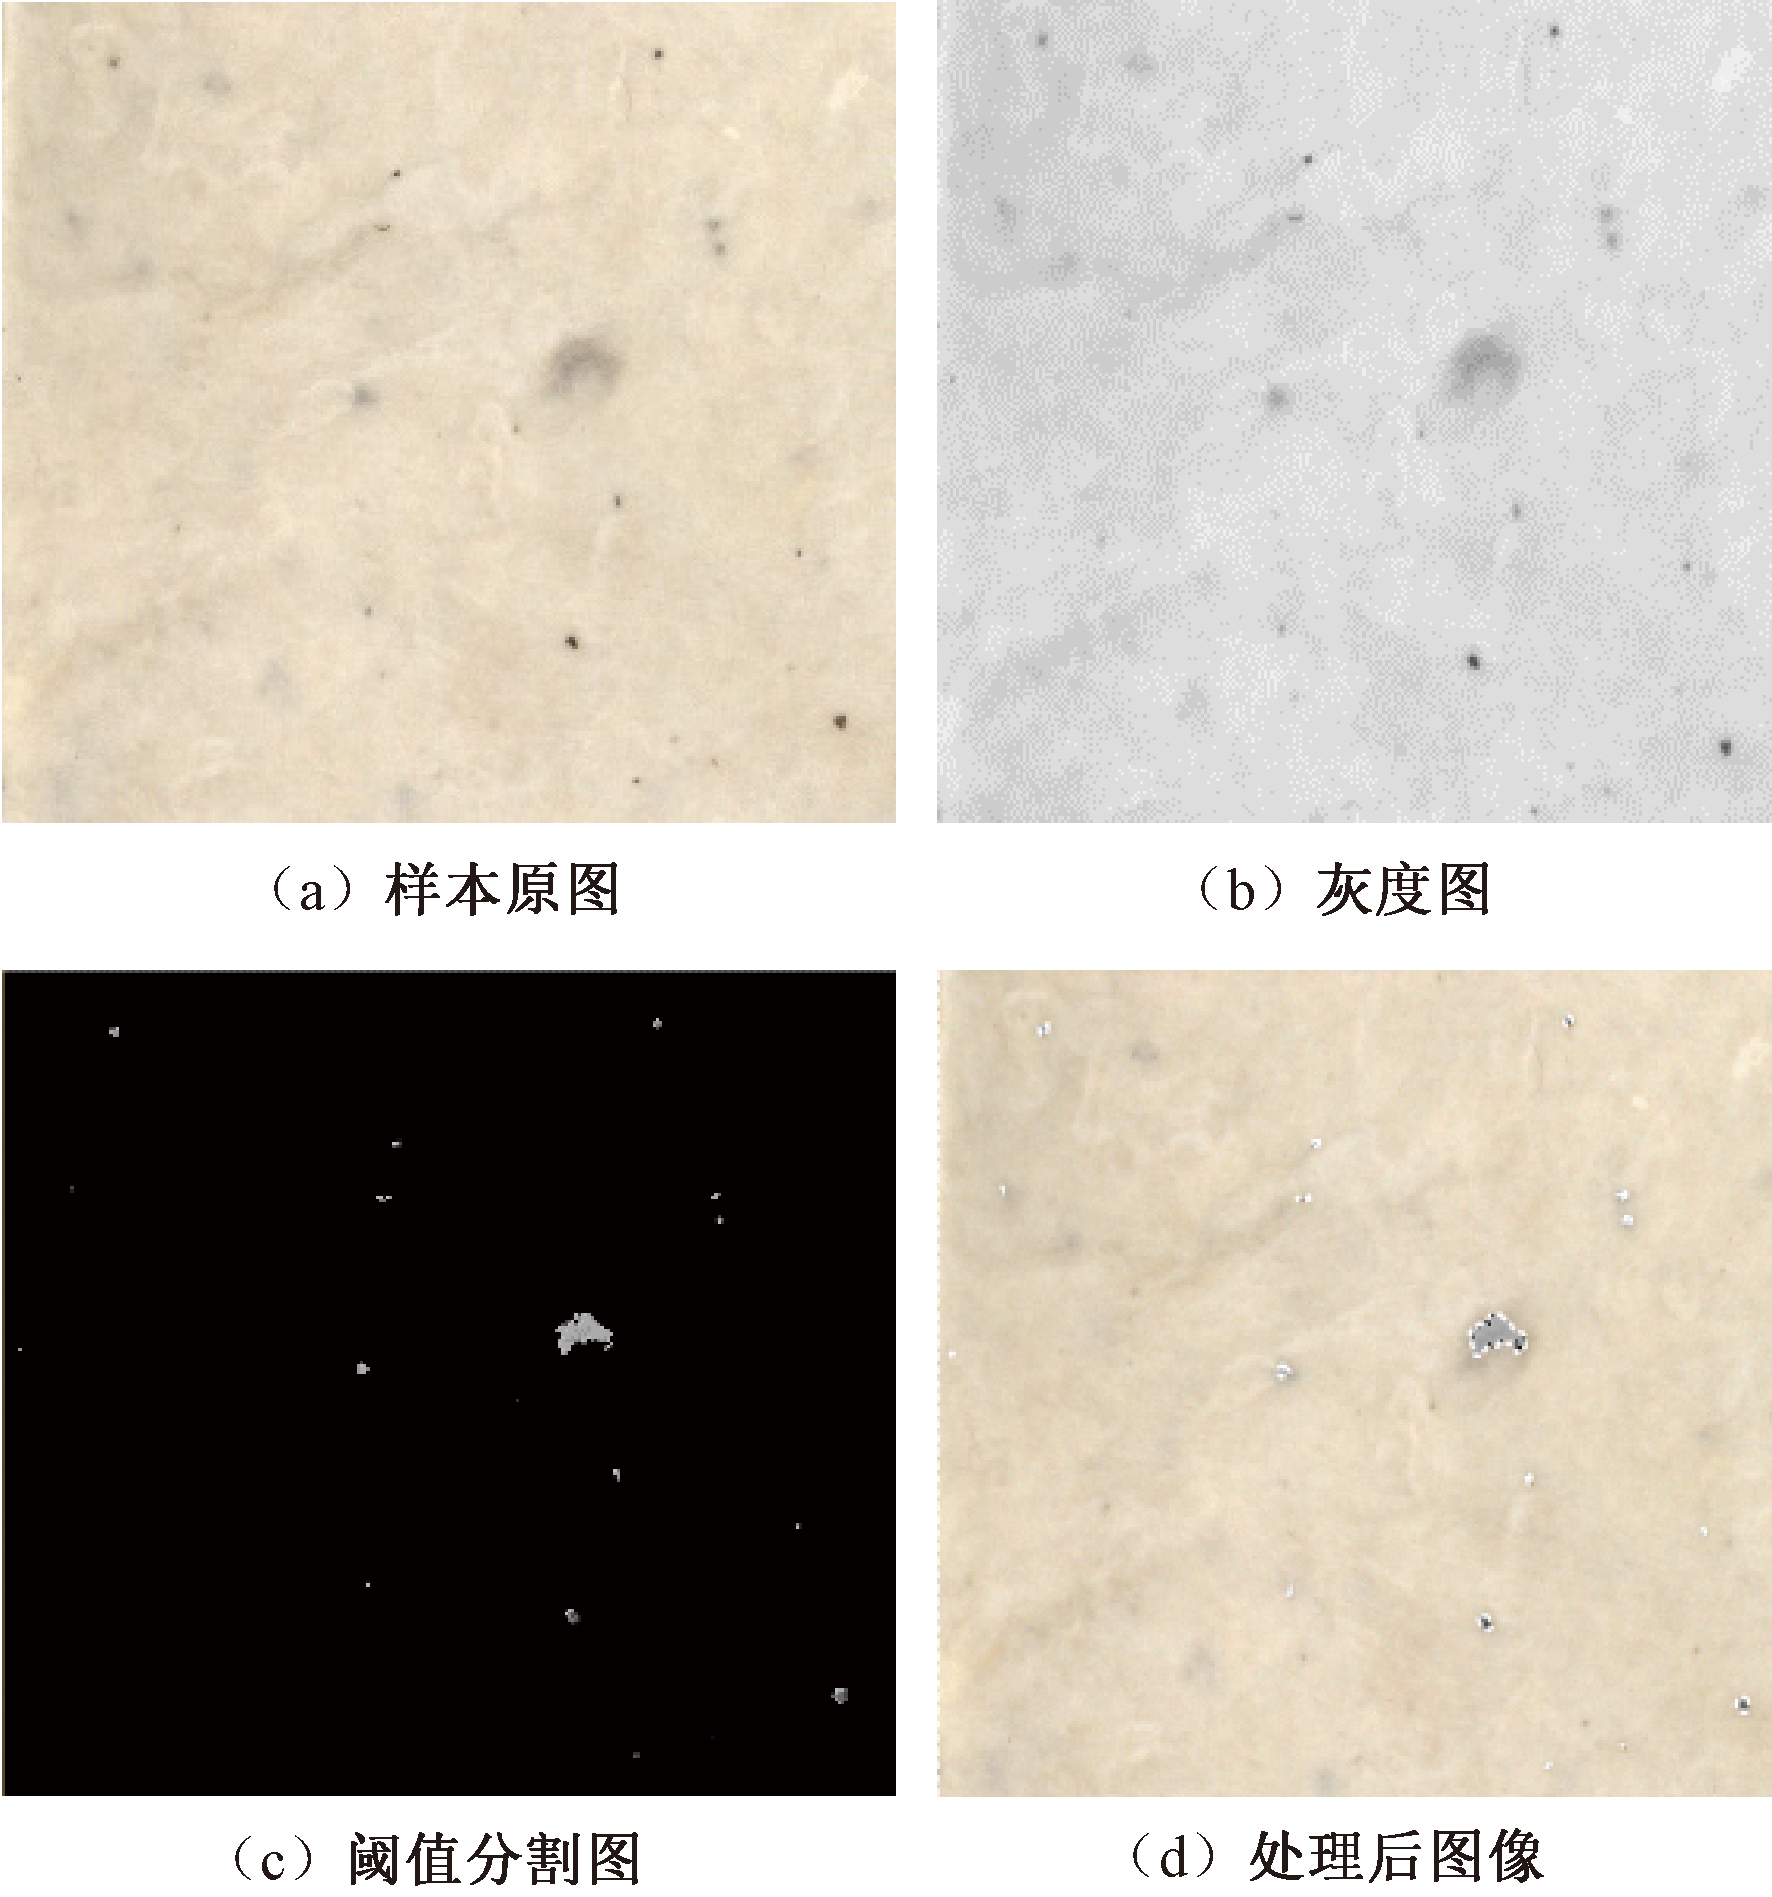
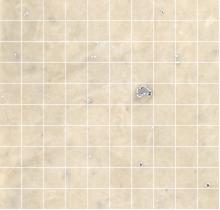
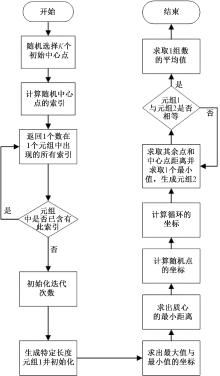
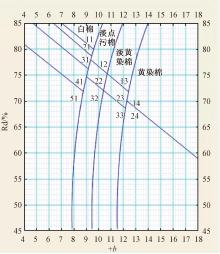
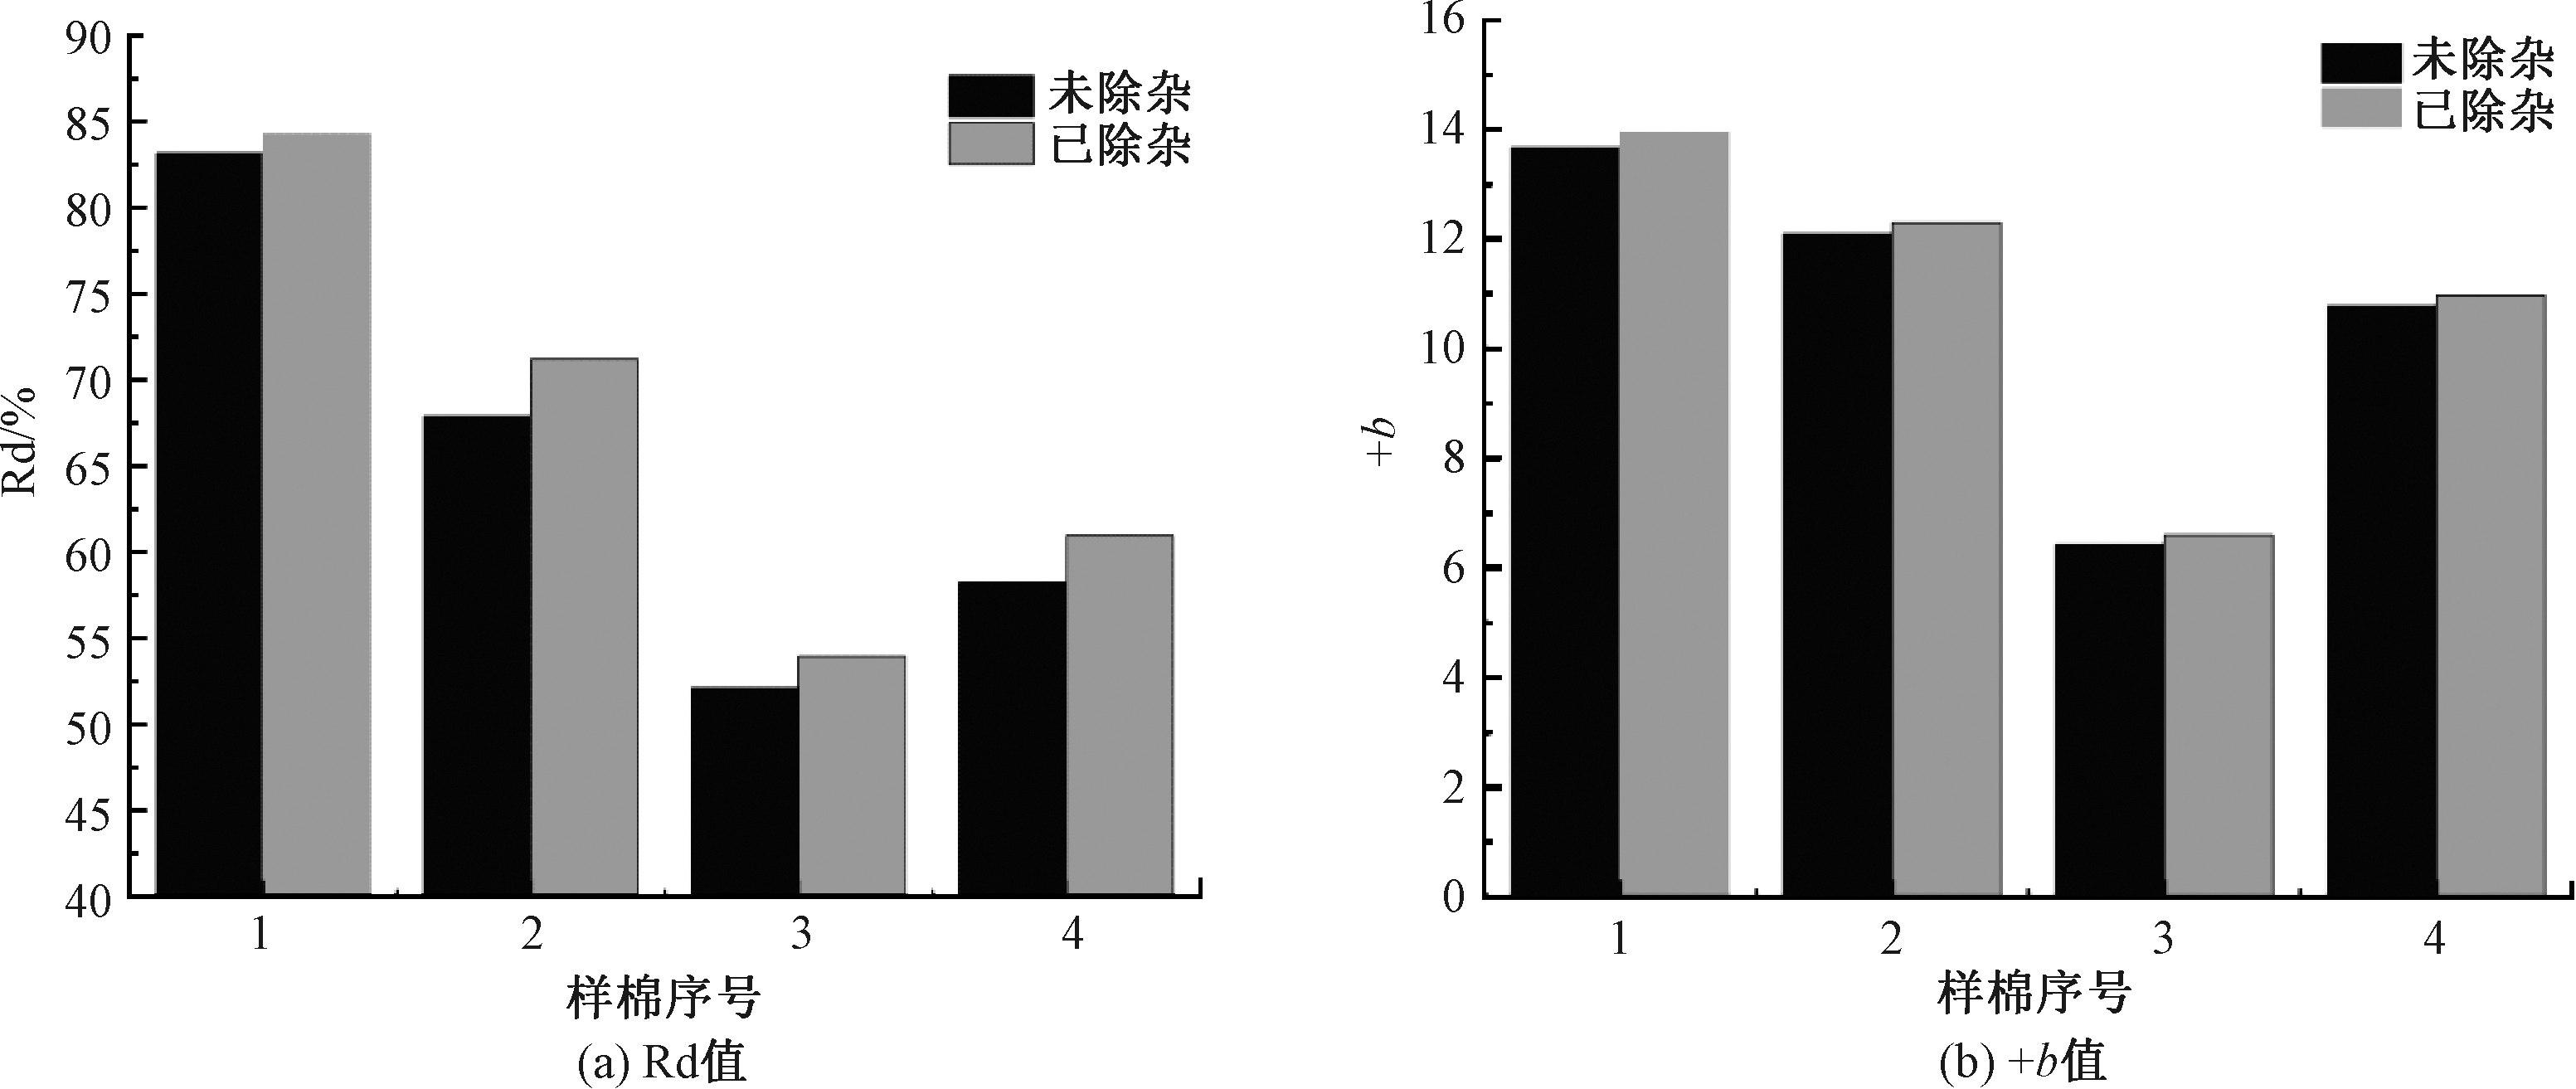
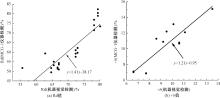
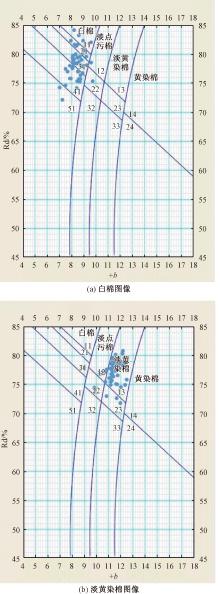
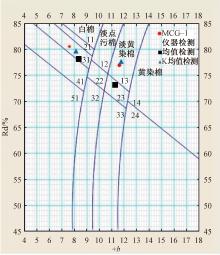
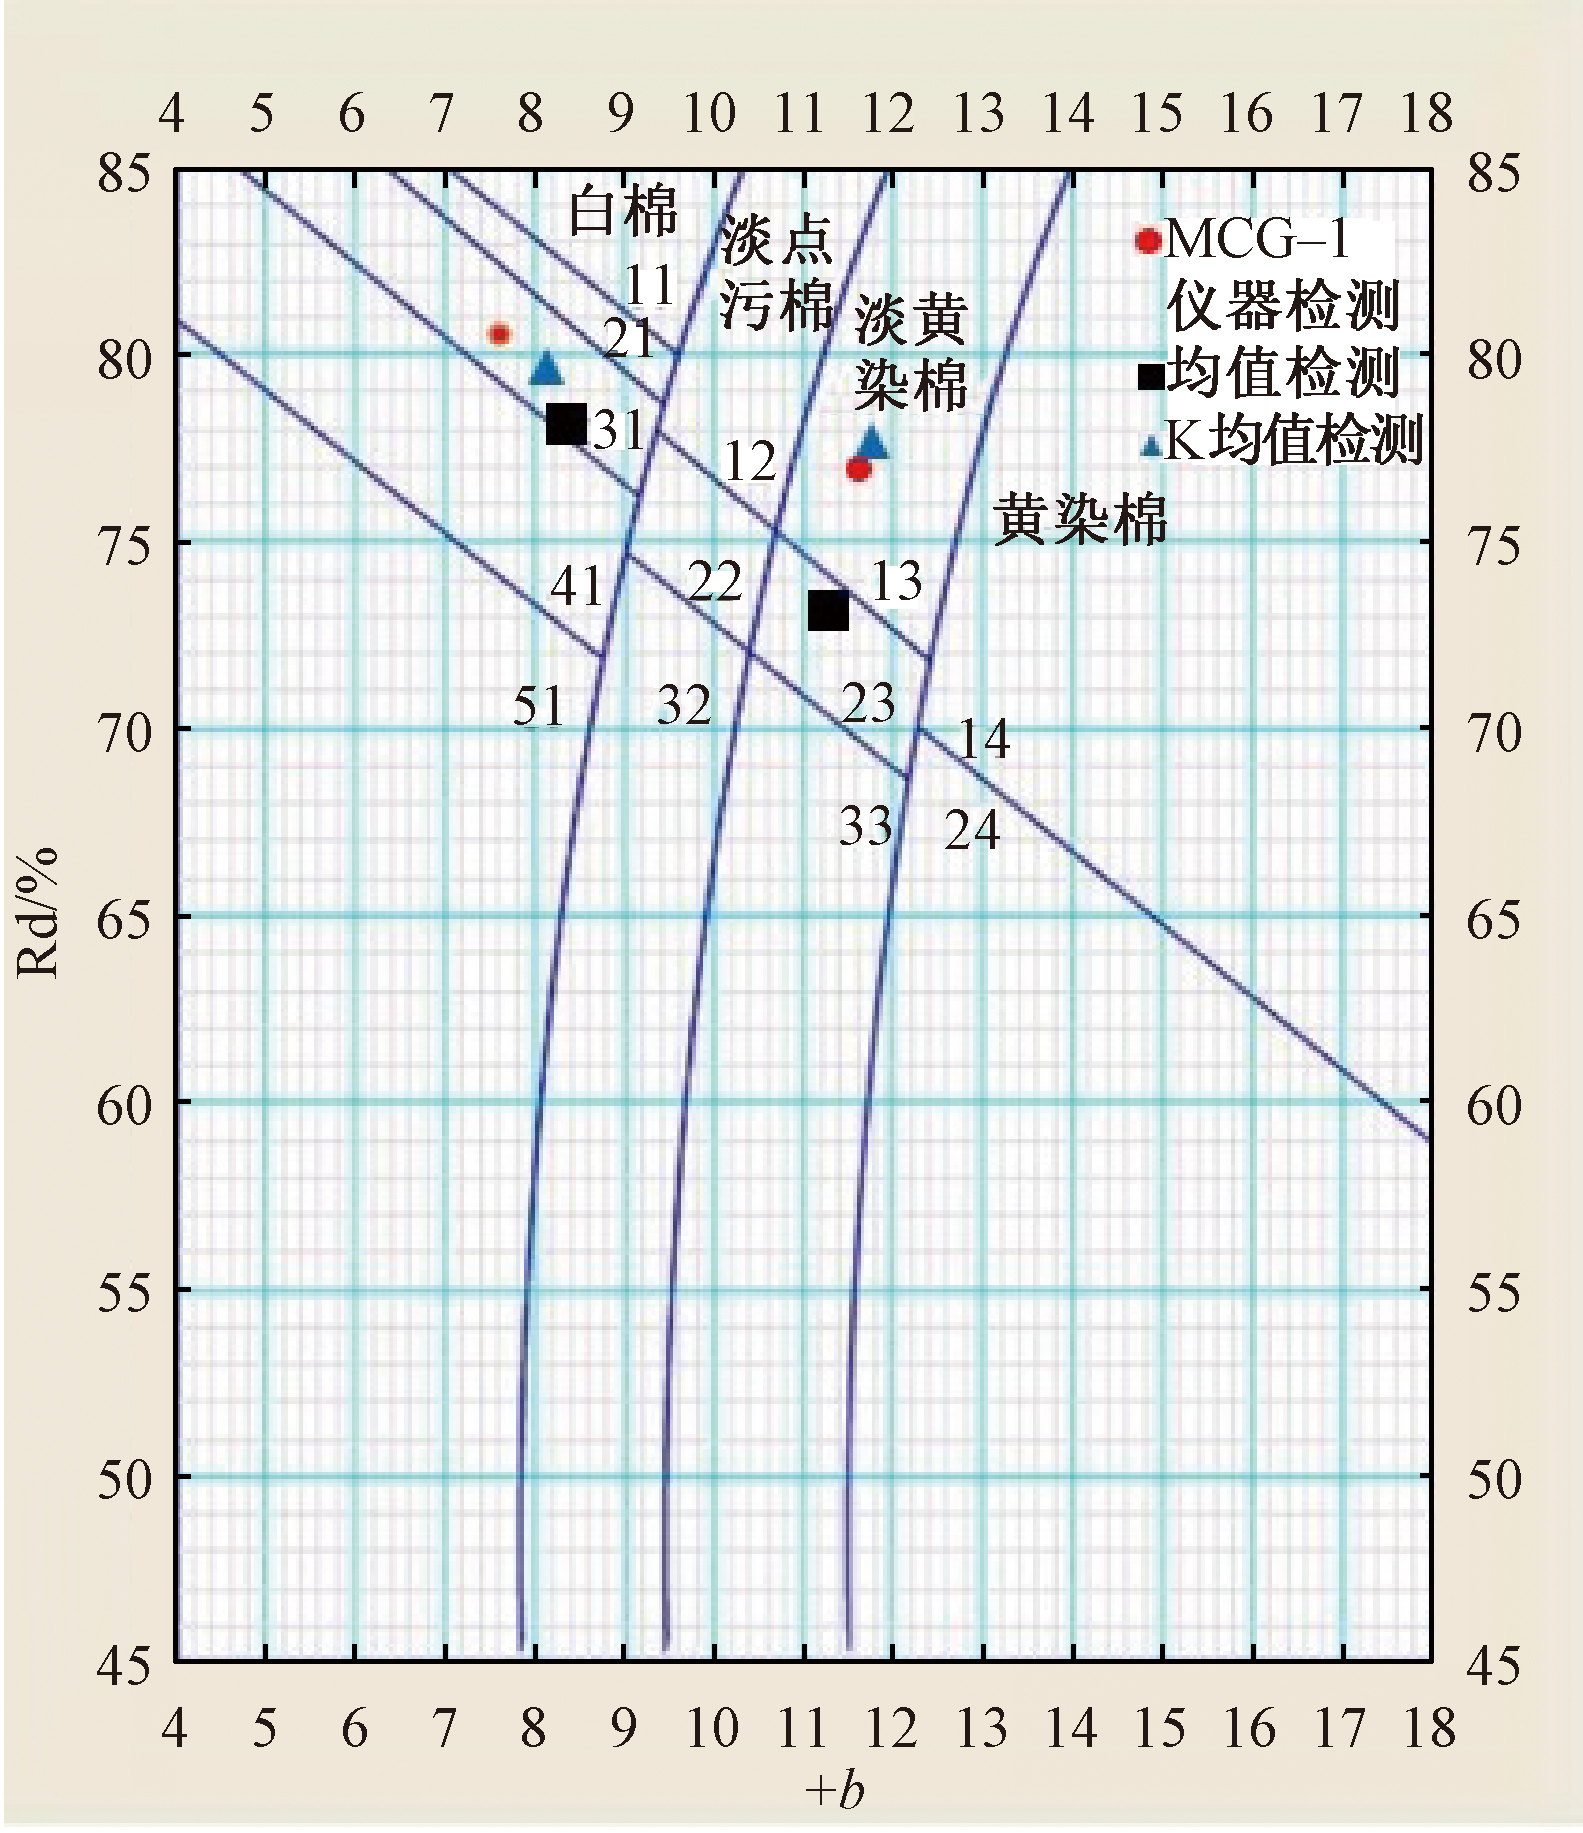
针对国内目前通过图像处理测量棉花颜色等级方法较少的现状,设计了一种基于机器视觉的棉花颜色检测方案。为提高棉花样本的拍摄质量及高效性,使用Halcon软件连接CMOS工业相机进行实时采集。首先对采集的棉花样本图进行预处理,通过阈值分割算法将棉花样本图转化为二值图像,且使用高斯滤波去噪声从而去除棉花中的杂质信息,并对预处理后的图像进行区域划分。然后通过RGB值转换为CIE XYZ颜色空间值,得到各子区域棉花颜色参数值,并引入K均值算法聚类各子区域颜色值以确定棉花最终颜色参数值,从而确定棉花颜色等级。最后通过实验验证及数据分析,将本文检测方法与MCG-1棉花检测仪器检测结果进行对比,结果表明2种方法检测结果一致;并通过在不同时间下持续对棉花样本进行数据检测,验证了本文方法的稳定性和精确性。本文检测方法可行且检测成本较低,可代替昂贵的仪器检测方法供企业使用。

关键词: 棉花, 颜色检测, 机器视觉, 阈值分割, 区域划分, K均值算法, 颜色等级

Abstract:

Objective At present, most of the domestic cotton testing instruments are adopted to detect cotton grades, but the specifications of instruments and equipment are expensive and cannot be used in a wider range. At present, fewer methods of using machine vision are adopted to detect the color grade of cotton, and the accuracy is not high. Therefore, in view of the above situation, a cotton color grade detection method based on machine vision was designed.

Method An experimental platform was firstly built. The light source was fixed to the aluminum profile frame and sealed. Cotton was collected in real time through a camera connected to a computer. The collected cotton sample image was transmitted to a computer and preprocessed, and the preprocessed image was cropped using Halcon software and divided into subregions. The albedo (Rd) and yellowness (+b) values of each subregion were calculated by the conversion of color space values, and the color value of each subregion was clustered by the K-means algorithm to obtain the color average of the overall image of cotton. Finally, it was compared with the national standard cotton color grade map to determine the final grade of cotton. Four different color grades of cotton were selected for impurity removal and non-impurity treatment, and the color parameters obtained after impurity removal and without impurity removal were calculated by Halcon software. For the same impurity removed cotton, the Rd value and +b value was calculated, and compared with the detection of MCG-1 detection instrument, the detection results were counted, and scatter plotted by using Origin software to observe the linear relationship between the two detection methods. In order to explore the stability of the test results under different durations, cotton was continuously tested in the time periods of 0 h, 12 h, 24 h, and 36 h in the same environment under the condition that the equipment was not turned off and the lights were not turned off. Finally, in order to explore whether the overall color value of cotton can represent the color grade of the entire cotton sample, two different color grades of white cotton and light yellow dyed cotton were selected for testing, and under the same conditions, the color value of each sub-region of the two cotton was calculated by using software, and the value of each sub-region was placed in the national standard cotton color grade chart for comparison to observe the distribution of the color grade of each sub-region.

Results It is found that the Rd value and +b value detected in the cotton after impurity removal were higher than those detected before impurity removal, but the Rd value increased more and the +b value increased less. For the same cotton, the color value of cotton detected by image processing method was compared with the color value obtained by MCG-1 cotton detector, and the two results were highly correlated and linear, indicating that the results detected by the two methods were consistent. Cotton was continuously tested at different lengths of 0-72 h, and it was found that the test results were stable at each duration, and all were in the same area. Compared with the MCG-1 test results, they were all the same grade cotton. The results of the K-means algorithm were compared with the mean detection, and the results of the K-means algorithm were closer to the results obtained by the MCG-1 cotton detection instrument, and the detection accuracy was better than the results obtained by the mean detection.

Conclusion Using machine vision methods to inspect cotton color grades improves the simplicity, efficiency, and accuracy of inspection. This technology not only solves the problem of expensive cotton testing instruments, but also solves the problem of fewer methods and insufficient accuracy of using image processing to detect cotton grades, and can replace the instrument used in practical cases. With the continuous development and maturity of machine vision technology, the technology could be made more useful in the field of cotton testing in the future, and in machine vision methods for cotton color detection. It is expected that this method can be used as a basis for image processing to detect cotton grades, and can be further improved and optimized.

Key words: cotton, color detection, machine vision, threshold segmentation, zoning, K-means algorithm, color grade

中图分类号: 

  • TS111.9

图1

相机的颜色标定"

图2

在2种观察位置采集的棉花样本"

图3

实验装置"

图4

棉花图像的预处理"

图5

区域划分"

图6

K均值算法编程流程图"

图7

国家标准棉花颜色等级图"

图8

杂质对Rd值和+b值的影响"

图9

机器视觉检测与MCG-1仪器检测的Rd值和+b值结果比较"

表1

不同时间下的检测结果"

序号 0 h 12 h 24 h 36 h
Rd +b Rd +b Rd +b Rd +b
1 78.9 9.1 77.6 9.3 81.2 9.6 81.5 9.0
2 80.3 9.2 79.7 9.2 79.3 8.5 78.9 8.6
3 73.2 9.5 71.1 9.7 70.6 9.5 72.8 8.9
4 67.8 8.1 66.4 8.3 67.5 7.6 66.2 7.3
5 73.3 10.9 72.8 11.4 70.8 10.9 72.7 11.8
6 63.5 10.7 62.0 9.6 60.8 10.5 63.3 10.5
7 78.6 10.5 82.4 11.1 77.9 10.8 78.2 9.4
8 63.7 7.1 63.5 7.5 64.2 6.9 65.1 6.3
9 56.3 7.4 55.4 7.4 57.5 8.0 58.4 7.7
10 66.9 9.7 67.7 9.8 66.8 10.2 67.5 10.1
11 62.2 12.9 62.8 13.6 63.2 13.0 64.3 13.1
12 58.7 12.9 59.4 12.8 57.9 11.6 58.2 12.9

表2

MCG-1仪器检测结果"

棉花序号 Rd +b
1 80.1 9.5
2 78.2 8.6
3 73.0 9.2
4 66.7 7.7
5 72.4 11.1
6 62.8 10.2
7 79.4 10.1
8 65.5 6.6
9 55.6 7.7
10 67.1 10.6
11 64.7 13.5
12 58.4 12.8

图10

2种不同棉花样本图像子区域颜色等级散点图"

图11

不同检测方法检测同一棉花样品结果比较"

[1] YAN Lv, YING Gao. Cotton appearance grade classification based on machine learning[J]. Procedia Computer Science, 2020, 174(5) :729-734.
doi: 10.1016/j.procs.2020.06.149
[2] CUI X, CAI Y, RODGERS J, et al. An investigation into the intra-sample variation in the color of cotton using image analysis[J]. Textile Research Journal, 2014, 84(2): 214-222.
doi: 10.1177/0040517513490055
[3] KHAN N, VIK M, VIKOVA M. Color measurement of cotton samples with feasibility of traceable color standards[C]// Svetlenka Workshop for Ph.D. Students Faculty of Textile Engineering. Liberec: Technical University of Liberec, 2015:1-20.
[4] 衡冲, 沈华, 陈丽君, 等. 扫描仪在棉纤维颜色检测的适用性[J]. 东华大学学报(自然科学版), 2020, 46(1):29-34.
HENG Chong, SHEN Hua, CHEN Lijun, et al. Applicability of scanner in cotton fiber color detection[J]. Journal of Donghua University(Natural Science), 2020, 46(1):29-34.
[5] HENG Chong, CHEN Lijun, SHEN Hua, et al. Study on the measurement and evaluation of cotton color using image analysis[J]. Materials Research Express, 2020, 7(7):8-9.
[6] RODGERS J E, FORTIER C A, CUI X, et al. Preliminary assessments of portable color spectrophotometer measurements of cotton color[C]// Proceedings of Beltwide Cotton Conferences. Atlanta: The National Cotton Council, 2012: 1313-1318.
[7] 王欣, 李道亮, 杨文注, 等. 基于可见光机器视觉的棉花伪异性纤维识别方法[J]. 农业机械学报, 2015, 46(8):7-14.
WANG Xin, LI Daoliang, YANG Wenzhu, et al. Identification method of pseudo-anisotropic fiber in cotton based on visible machine vision[J]. Transactions of the Chinese Society for Agricultural Machinery, 2015, 46(8):7-14.
[8] YANG Wenzhu, LU Sukui, WANG Sile, et al. Fast recongnition of foreign fibers in cotton lint using machine vision[J]. Mathematical and Computer Modelling, 2010(3):10-12.
[9] 华才健, 苏真伟, 乔丽, 等. 基于线激光的棉花中白色异性纤维检测[J]. 农业工程学报, 2012, 43(2):181-185.
HUA Caijian, SU Zhenwei, QIAO Li, et al. Detection of white anisosexual fibers in cotton based on line laser[J]. Transactions of the Chinese Society of Agricultura Engineering, 2012, 43(2):181-185.
[10] DEMPSTER A P, LAIRD N M, RUBIN D B. Maximum likelihood from incomplete data via the EM algorithm[J]. Journal of the Royal Statistical Society: Series B(Methodological), 1977, 39(1):1-22.
[11] MUSTAFIC A, LI C. Classification of cotton foreign matter using color features extracted from fluorescent images[J]. Textile Research Journal, 2015, 85(12): 1209-1220.
doi: 10.1177/0040517514561923
[12] 陆永良, 袁裕禄, 李云飞. 基于国际颜色模型(CIELAB)的棉花颜色级测试方法研究[J]. 中国纤检, 2016(3):90-93.
LU Yongliang, YUAN Yulu, LI Yunfei. Research on cotton color grade test method based on international color model (CIELAB)[J]. China Fiber Inspection, 2016(3):90-93.
[13] VIK M, KHAN N, VIKOVA M. LED utilization in cotton color measurement[J]. Journal of Natural Fibers, 2017, 14(4):574-585.
[14] ARISTIDIS Likas, NIKOS Vlassis. The global K-means clustering algorithm[J]. Pattern Recognition, 2003(36) : 451-461.
[1] 葛苏敏, 林瑞冰, 徐平华, 吴思熠, 罗芊芊. 基于机器视觉的曲面枕个性化定制方法[J]. 纺织学报, 2024, 45(02): 214-220.
[2] 师红宇, 位营杰, 管声启, 李怡. 基于残差结构的棉花异性纤维检测算法[J]. 纺织学报, 2023, 44(12): 35-42.
[3] 史伟民, 韩思捷, 屠佳佳, 陆伟健, 段玉堂. 基于机器视觉的空纱筒口定位方法[J]. 纺织学报, 2023, 44(11): 105-112.
[4] 陈罡, 金贵阳, 吴菁, 罗千. 智能服装缝制关键技术及成套装备研发[J]. 纺织学报, 2023, 44(08): 197-204.
[5] 陈泰芳, 周亚勤, 汪俊亮, 徐楚桥, 李冬武. 基于视觉特征强化的环锭纺细纱断头在线检测方法[J]. 纺织学报, 2023, 44(08): 63-72.
[6] 纪越, 潘东, 马杰东, 宋丽梅, 董九志. 基于机器视觉的弦振动纱线张力非接触检测系统[J]. 纺织学报, 2023, 44(05): 198-204.
[7] 陶静, 汪俊亮, 徐楚桥, 张洁. 基于视觉校准的环锭纺细纱条干特征在线提取方法[J]. 纺织学报, 2023, 44(04): 70-77.
[8] 王斌, 李敏, 雷承霖, 何儒汉. 基于深度学习的织物疵点检测研究进展[J]. 纺织学报, 2023, 44(01): 219-227.
[9] 吴帆, 李勇, 陈晓川, 汪军, 徐敏俊. 基于三维编织模型的棉纤维集合体压缩过程有限元建模与仿真[J]. 纺织学报, 2022, 43(09): 89-94.
[10] 金守峰, 侯一泽, 焦航, 张鹏, 李宇涛. 基于改进AlexNet模型的抓毛织物质量检测方法[J]. 纺织学报, 2022, 43(06): 133-139.
[11] 周其洪, 彭轶, 岑均豪, 周申华, 李姝佳. 基于机器视觉的细纱接头机器人纱线断头定位方法[J]. 纺织学报, 2022, 43(05): 163-169.
[12] 吕文涛, 林琪琪, 钟佳莹, 王成群, 徐伟强. 面向织物疵点检测的图像处理技术研究进展[J]. 纺织学报, 2021, 42(11): 197-206.
[13] 吴柳波, 李新荣, 杜金丽. 基于轮廓提取的缝纫机器人运动轨迹规划研究进展[J]. 纺织学报, 2021, 42(04): 191-200.
[14] 李东洁, 郭帅, 杨柳. 基于改进图像阈值分割算法的纱线疵点检测[J]. 纺织学报, 2021, 42(03): 82-88.
[15] 田宇航, 王绍宗, 张文昌, 张倩. 基于机器视觉的单组分染液浓度快速检测方法[J]. 纺织学报, 2021, 42(03): 115-121.
Viewed
Full text


Abstract

Cited

  Shared   
  Discussed   
No Suggested Reading articles found!