纺织学报 ›› 2022, Vol. 43 ›› Issue (10): 38-44.doi: 10.13475/j.fzxb.20210904207

• 纺织工程 • 上一篇    下一篇

基于视觉特性的色纺纱全光谱配色算法优化

程璐1, 马崇启2, 周惠敏1, 王颖1, 夏鑫1()   

  1. 1.新疆大学, 新疆 乌鲁木齐 830046
    2.天津工业大学 纺织科学与工程学院, 天津 300387
  • 收稿日期:2021-09-13 修回日期:2022-04-04 出版日期:2022-10-15 发布日期:2022-10-28
  • 通讯作者: 夏鑫
  • 作者简介:程璐(1993—),女,讲师,硕士。主要研究方向为色纺纱计算机测配色。
  • 基金资助:
    新疆维吾尔自治区自然科学基金项目(2020D01C079);国家自然科学基金项目(51963020)

Optimization of full spectrum color matching algorithm for color spun yarn based on visual characteristics

CHENG Lu1, MA Chongqi2, ZHOU Huimin1, WANG Ying1, XIA Xin1()   

  1. 1. Xinjiang University, Urumqi, Xinjiang 830046, China
    2. School of Textile Science and Engineering, Tiangong University, Tianjin 300387, China
  • Received:2021-09-13 Revised:2022-04-04 Published:2022-10-15 Online:2022-10-28
  • Contact: XIA Xin

摘要:

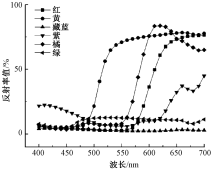
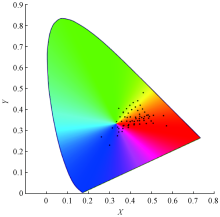
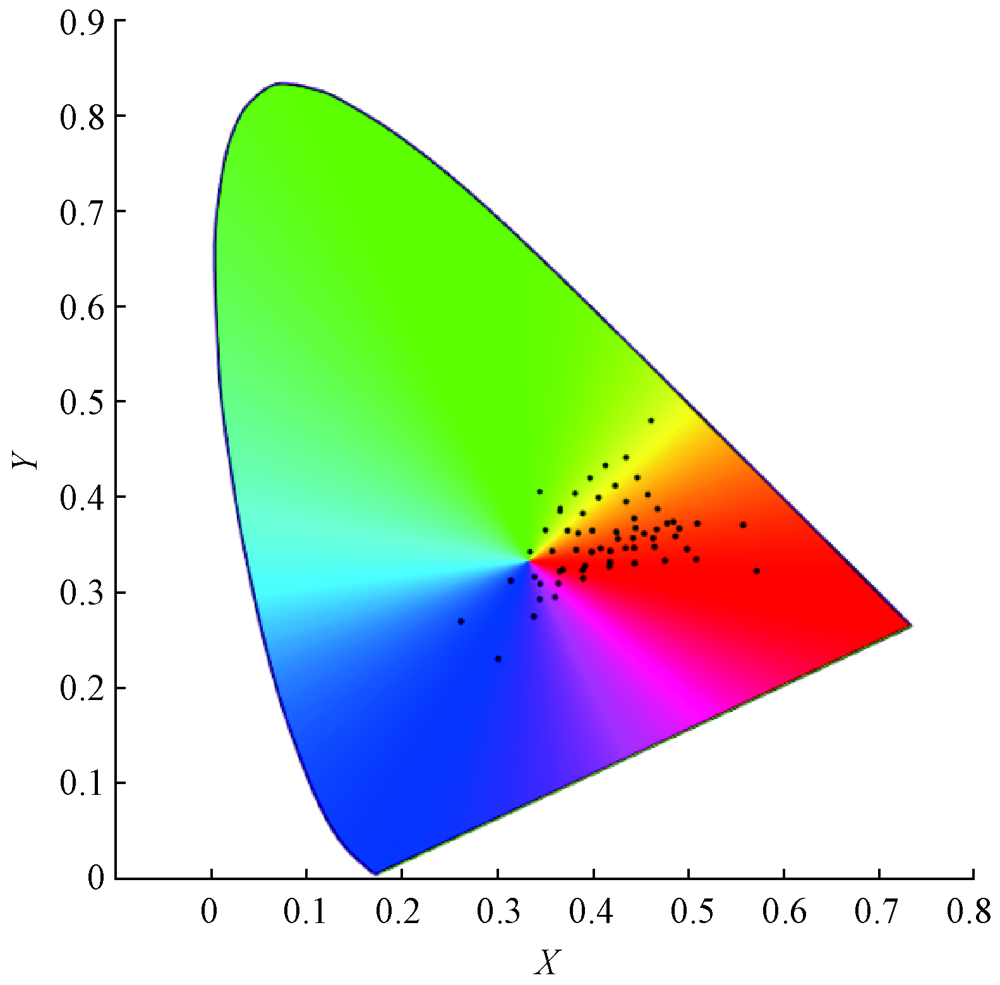
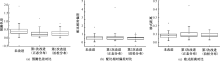
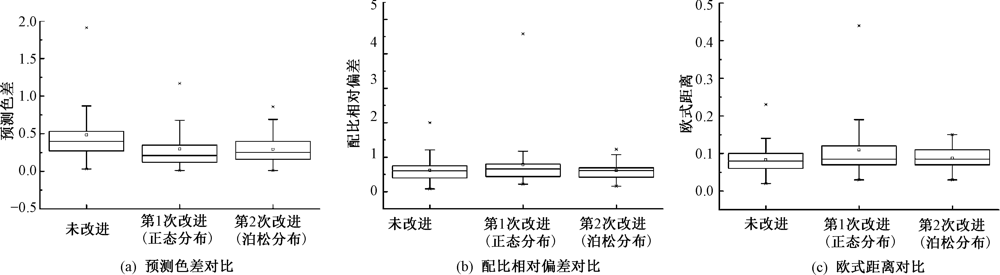
为提高色纺纱计算机配色算法的精准性及适用性,针对目前配色算法难以同时保证理论计算的色差值及配比相对偏差同时最小的问题,以全光谱配色算法为基础,结合经典Stearns-Noechel光学理论模型,探索人眼视觉特性以确定视觉特性对不同波长下反射光的敏感系数,并将其引入配色算法中进行加权计算,预测单色纤维混合配比,同时,综合预测色差值、配比相对偏差值及欧式距离等对配色效果进行评价。结果表明,引入泊松分布赋值人眼敏感系数的配色算法结果最优,平均预测色差值为0.29,且均在1以内,平均配比相对偏差值为0.612,最小,欧式距离均值为0.087,相对较小;改进之后的配色算法通过一次计算即可实现预测色差值最小,且预测配比精准,针对色纺纱可初步实现计算机精准配色。

关键词: 色纺纱, 全光谱配色, 视觉特性, 色差, 配比相对偏差, 计算机配色算法

Abstract:

In order to improve the accuracy and applicability of computer color matching algorithm for color spunyarns, a full-spectrum color matching algorithm was proposed based on the classical Stearns Noechel optical theoretical model, aiming at the problems that it is difficult to minimize error in calculated color difference value and that in matching relative deviation. The sensitivity coefficient of human visual characteristics to reflected light at different wavelengths was determined by exploring human visual characteristics, and it was introduced into the color matching algorithm for weighted calculation to predict the monochrome fiber mixing ratio. The color matching effect was evaluated by predicting the color difference value, the relative deviation value of the ratio and the Euclidean distance. Results show that the color matching algorith with Poisson distribution introduced to the human eye sensitivity coefficient is optimal, with the average prediction color difference value being 0.29 and all within 1, the ratio of the average relative deviation value being minimal 0.612, Euclidean distance average being 0.087 which is relatively small. When using the improved color matching algorithm, the prediction of the color difference value can be achieved through one calculation, leading to a small color difference with higher accuracy. With the improved algorithm, computer assisted color matching for color spunyarns can be primarily achieved.

Key words: color spun yarn, full spectrum color matching, visual characteristic, color difference, relative deviation in color matching, computer color matching algorithm

中图分类号: 

  • TS104.5

图1

单色样品反射率曲线"

表1

不同颜色试样编号及纤维质量比"

试样
编号
纤维
质量比
试样
编号
纤维
质量比
试样
编号
纤维
质量比
1# 0.1∶0.8∶0.1 19# 0.3∶0.5∶0.2 37# 0.1∶0.7∶0.2
2# 0.1∶0.7∶0.2 20# 0.3∶0.3∶0.4 38# 0.1∶0.1∶0.8
3# 0.1∶0.6∶0.3 21# 0.3∶0.2∶0.5 39# 0.2∶0.7∶0.1
4# 0.1∶0.5∶0.4 22# 0.3∶0.1∶0.6 40# 0.2∶0.6∶0.2
5# 0.1∶0.4∶0.5 23# 0.4∶0.5∶0.1 41# 0.2∶0.5∶0.3
6# 0.1∶0.3∶0.6 24# 0.4∶0.4∶0.2 42# 0.3∶0.6∶0.1
7# 0.1∶0.2∶0.7 25# 0.4∶0.3∶0.3 43# 0.3∶0.5∶0.2
8# 0.1∶0.1∶0.8 26# 0.4∶0.2∶0.4 44# 0.3∶0.4∶0.3
9# 0.2∶0.7∶0.1 27# 0.4∶0.1∶0.5 45# 0.4∶0.5∶0.1
10# 0.2∶0.6∶0.2 28# 0.5∶0.4∶0.1 46# 0.4∶0.4∶0.2
11# 0.2∶0.5∶0.3 29# 0.5∶0.3∶0.2 47# 0.4∶0.3∶0.3
12# 0.2∶0.4∶0.4 30# 0.5∶0.2∶0.3 48# 0.5∶0.4∶0.1
13# 0.2∶0.3∶0.5 31# 0.5∶0.1∶0.4 49# 0.5∶0.3∶0.2
14# 0.2∶0.2∶0.6 32# 0.6∶0.3∶0.1 50# 0.6∶0.3∶0.1
15# 0.2∶0.1∶0.7 33# 0.6∶0.2∶0.2 51# 0.6∶0.2∶0.2
16# 0.3∶0.6∶0.1 34# 0.6∶0.1∶0.3 52# 0.7∶0.2∶0.1
17# 0.1∶0.8∶0.1 35# 0.7∶0.2∶0.1 53# 0.7∶0.1∶0.2
18# 0.1∶0.7∶0.2 36# 0.1∶0.8∶0.1 54# 0.8∶0.1∶0.1

图2

样品色度图"

表2

未改进初次预测计算结果"

样品编号 预测配比 色差 配比偏差 欧式距离 样品编号 预测配比 色差 配比偏差 欧式距离
1# 0.08∶0.73∶0.19 0.20 1.21 0.11 28# 0.45∶0.28∶0.27 0.40 0.60 0.10
2# 0.05∶0.70∶0.24 0.15 0.71 0.07 29# 0.51∶0.16∶0.33 0.46 0.80 0.09
3# 0.05∶0.63∶0.32 0.16 0.61 0.06 30# 0.51∶0.35∶0.14 0.40 0.70 0.11
4# 0.05∶0.57∶0.37 0.04 0.68 0.09 31# 0.53∶0.26∶0.21 0.47 0.49 0.10
5# 0.06∶0.50∶0.44 0.11 0.75 0.12 32# 0.58∶0.16∶0.25 0.51 0.82 0.08
6# 0.07∶0.37∶0.56 0.04 0.61 0.09 33# 0.62∶0.25∶0.13 0.51 0.65 0.10
7# 0.09∶0.30∶0.61 0.28 0.70 0.13 34# 0.66∶0.17∶0.17 0.52 0.93 0.09
8# 0.15∶0.23∶0.62 0.62 2.00 0.23 35# 0.72∶0.17∶0.11 0.53 0.86 0.10
9# 0.18∶0.62∶0.20 0.05 1.21 0.13 36# 0.10∶0.79∶0.11 1.28 0.14 0.02
10# 0.16∶0.53∶0.31 0.06 0.90 0.14 37# 0.14∶0.70∶0.15 1.91 0.68 0.06
11# 0.15∶0.50∶0.36 0.03 0.46 0.08 38# 0.08∶0.15∶0.77 0.53 0.70 0.06
12# 0.15∶0.46∶0.39 0.13 0.40 0.07 39# 0.17∶0.72∶0.12 0.59 0.35 0.04
13# 0.16∶0.36∶0.48 0.27 0.42 0.07 40# 0.22∶0.62∶0.15 1.57 0.40 0.06
14# 0.20∶0.30∶0.50 0.45 0.70 0.14 41# 0.23∶0.54∶0.23 1.63 0.49 0.09
15# 0.25∶0.19∶0.56 0.49 1.38 0.18 42# 0.29∶0.61∶0.10 0.87 0.08 0.02
16# 0.25∶0.59∶0.16 0.15 0.79 0.08 43# 0.28∶0.52∶0.20 0.78 0.13 0.03
17# 0.25∶0.46∶0.29 0.20 0.71 0.11 44# 0.26∶0.45∶0.29 0.86 0.31 0.07
18# 0.25∶0.31∶0.44 0.26 0.32 0.07 45# 0.35∶0.53∶0.12 0.37 0.37 0.06
19# 0.27∶0.23∶0.51 0.31 0.27 0.05 46# 0.39∶0.43∶0.17 0.76 0.24 0.04
20# 0.31∶0.15∶0.54 0.31 0.63 0.08 47# 0.46∶0.34∶0.20 1.17 0.59 0.12
21# 0.35∶0.46∶0.18 0.29 1.02 0.10 48# 0.47∶0.44∶0.09 0.41 0.23 0.05
22# 0.33∶0.44∶0.24 0.29 0.46 0.09 49# 0.51∶0.33∶0.16 0.66 0.32 0.05
23# 0.34∶0.35∶0.31 0.32 0.36 0.08 50# 0.60∶0.33∶0.07 0.37 0.45 0.05
24# 0.37∶0.27∶0.36 0.35 0.52 0.08 51# 0.61∶0.21∶0.18 0.50 0.17 0.02
25# 0.42∶0.16∶0.42 0.40 0.79 0.10 52# 0.76∶0.20∶0.04 0.51 0.67 0.08
26# 0.43∶0.40∶0.16 0.39 0.77 0.09 53# 0.72∶0.13∶0.15 0.34 0.58 0.06
27# 0.42∶0.35∶0.22 0.39 0.44 0.10 54# 0.80∶0.12∶0.08 0.53 0.49 0.03

表3

第1次优化初次预测计算结果(正态分布)"

样品编号 预测配比 色差 配比偏差 欧式距离 样品编号 预测配比 色差 配比偏差 欧式距离
1# 0.07∶0.76∶0.16 0.26 0.97 0.08 28# 0.46∶0.26∶0.28 0.04 0.41 0.07
2# 0.05∶0.72∶0.23 0.23 0.68 0.06 29# 0.34∶0.06∶0.60 0.18 1.18 0.26
3# 0.05∶0.63∶0.32 0.22 0.61 0.06 30# 0.53∶0.32∶0.15 0.21 0.66 0.09
4# 0.05∶0.57∶0.37 0.05 0.68 0.09 31# 0.54∶0.25∶0.21 0.30 0.41 0.08
5# 0.06∶0.52∶0.42 0.11 0.83 0.15 32# 0.59∶0.16∶0.25 0.13 0.73 0.07
6# 0.07∶0.40∶0.53 0.06 0.71 0.12 33# 0.49∶0.06∶0.46 0.18 4.58 0.44
7# 0.09∶0.29∶0.62 0.33 0.66 0.13 34# 0.52∶0.06∶0.42 0.06 1.75 0.29
8# 0.15∶0.22∶0.63 0.68 1.91 0.21 35# 0.62∶0.05∶0.32 0.26 2.95 0.29
9# 0.17∶0.64∶0.19 0.04 1.07 0.11 36# 0.11∶0.82∶0.07 0.72 0.47 0.04
10# 0.15∶0.55∶0.29 0.12 0.78 0.11 37# 0.15∶0.73∶0.12 1.17 1.00 0.10
11# 0.15∶0.50∶0.35 0.03 0.44 0.07 38# 0.08∶0.13∶0.79 0.16 0.56 0.04
12# 0.15∶0.49∶0.35 0.06 0.59 0.12 39# 0.17∶0.74∶0.10 0.32 0.25 0.05
13# 0.17∶0.41∶0.42 0.21 0.67 0.14 40# 0.23∶0.65∶0.11 0.96 0.68 0.11
14# 0.20∶0.32∶0.48 0.48 0.79 0.17 41# 0.25∶0.57∶0.18 0.87 0.76 0.15
15# 0.26∶0.19∶0.55 0.51 1.43 0.19 42# 0.29∶0.63∶0.08 0.66 0.24 0.03
16# 0.26∶0.58∶0.17 0.14 0.83 0.08 43# 0.29∶0.55∶0.15 0.09 0.36 0.07
17# 0.24∶0.50∶0.26 0.20 0.51 0.08 44# 0.28∶0.49∶0.23 0.22 0.53 0.11
18# 0.26∶0.34∶0.40 0.21 0.29 0.06 45# 0.36∶0.55∶0.10 0.02 0.25 0.07
19# 0.28∶0.25∶0.47 0.18 0.36 0.06 46# 0.41∶0.46∶0.13 0.05 0.53 0.09
20# 0.32∶0.16∶0.52 0.11 0.76 0.10 47# 0.47∶0.36∶0.18 0.70 0.78 0.15
21# 0.35∶0.47∶0.18 0.34 0.95 0.10 48# 0.48∶0.45∶0.07 0.16 0.48 0.06
22# 0.33∶0.43∶0.24 0.15 0.43 0.08 49# 0.55∶0.34∶0.11 0.30 0.65 0.11
23# 0.35∶0.35∶0.31 0.12 0.32 0.07 50# 0.61∶0.33∶0.05 0.35 0.61 0.06
24# 0.37∶0.25∶0.37 0.01 0.41 0.07 51# 0.61∶0.22∶0.17 0.47 0.22 0.03
25# 0.29∶0.07∶0.64 0.24 0.85 0.18 52# 0.76∶0.20∶0.04 0.87 0.69 0.08
26# 0.45∶0.39∶0.17 0.36 0.80 0.09 53# 0.72∶0.13∶0.15 0.34 0.59 0.06
27# 0.43∶0.34∶0.23 0.21 0.40 0.08 54# 0.80∶0.13∶0.08 0.54 0.49 0.03

表4

第2次优化初次预测计算结果(泊松分布)"

样品编号 预测配比 色差 配比偏差 欧式距离 样品编号 预测配比 色差 配比偏差 欧式距离
1# 0.07∶0.75∶0.18 0.08 1.07 0.09 28# 0.45∶0.26∶0.29 0.23 0.42 0.08
2# 0.05∶0.73∶0.22 0.13 0.65 0.06 29# 0.50∶0.15∶0.35 0.24 0.63 0.07
3# 0.05∶0.64∶0.31 0.13 0.60 0.06 30# 0.51∶0.36∶0.13 0.21 0.69 0.12
4# 0.05∶0.58∶0.37 0.02 0.69 0.09 31# 0.52∶0.29∶0.19 0.35 0.62 0.12
5# 0.06∶0.50∶0.44 0.05 0.75 0.13 32# 0.58∶0.16∶0.26 0.31 0.73 0.07
6# 0.07∶0.38∶0.55 0.01 0.64 0.10 33# 0.62∶0.25∶0.13 0.49 0.66 0.10
7# 0.09∶0.29∶0.62 0.19 0.63 0.11 34# 0.65∶0.17∶0.18 0.38 0.92 0.09
8# 0.13∶0.18∶0.69 0.55 1.23 0.14 35# 0.71∶0.20∶0.09 0.51 1.16 0.13
9# 0.18∶0.63∶0.19 0.01 1.12 0.11 36# 0.09∶0.84∶0.07 0.48 0.43 0.05
10# 0.15∶0.55∶0.30 0.05 0.81 0.12 37# 0.12∶0.73∶0.15 0.86 0.54 0.07
11# 0.15∶0.50∶0.36 0.03 0.46 0.08 38# 0.08∶0.16∶0.77 0.35 0.83 0.07
12# 0.15∶0.49∶0.36 0.08 0.57 0.11 39# 0.16∶0.73∶0.11 0.19 0.35 0.05
13# 0.17∶0.39∶0.44 0.08 0.58 0.11 40# 0.21∶0.66∶0.12 0.64 0.55 0.10
14# 0.19∶0.29∶0.51 0.31 0.65 0.13 41# 0.22∶0.56∶0.21 0.85 0.54 0.11
15# 0.24∶0.17∶0.58 0.36 1.12 0.15 42# 0.30∶0.63∶0.07 0.40 0.35 0.04
16# 0.22∶0.65∶0.13 0.04 0.63 0.09 43# 0.27∶0.53∶0.20 0.50 0.16 0.04
17# 0.25∶0.47∶0.29 0.16 0.69 0.11 44# 0.26∶0.46∶0.28 0.64 0.34 0.07
18# 0.25∶0.37∶0.38 0.21 0.42 0.08 45# 0.35∶0.54∶0.12 0.22 0.39 0.07
19# 0.28∶0.25∶0.47 0.21 0.42 0.07 46# 0.40∶0.44∶0.17 0.52 0.26 0.05
20# 0.33∶0.17∶0.50 0.09 1.00 0.13 47# 0.46∶0.34∶0.20 0.69 0.64 0.13
21# 0.35∶0.46∶0.19 0.28 1.05 0.10 48# 0.47∶0.44∶0.09 0.28 0.25 0.05
22# 0.32∶0.45∶0.23 0.17 0.45 0.10 49# 0.52∶0.33∶0.15 0.45 0.35 0.06
23# 0.34∶0.35∶0.31 0.20 0.35 0.08 50# 0.61∶0.33∶0.06 0.26 0.49 0.05
24# 0.36∶0.25∶0.39 0.19 0.38 0.07 51# 0.61∶0.21∶0.18 0.34 0.19 0.03
25# 0.42∶0.15∶0.44 0.18 0.65 0.08 52# 0.76∶0.20∶0.04 0.48 0.68 0.08
26# 0.42∶0.44∶0.14 0.27 0.70 0.10 53# 0.73∶0.13∶0.15 0.22 0.60 0.07
27# 0.43∶0.34∶0.23 0.30 0.44 0.09 54# 0.80∶0.12∶0.07 0.37 0.53 0.04

图3

配色算法改进前后对比"

[1] 徐亚亚, 杨瑞华, 邓茜茜. 多通道转杯纺羊毛织物的Stearns-Noechel配色模型[J]. 东华大学学报(自然科学版), 2020, 46(3):357-361.
XU Yaya, YANG Ruihua, DENG Qianqian. Stearns-Noechel color matching model for multi-channel rotor spun wool fabric[J]. Journal of Donghua Univer-sity(Nutural Science Edition), 2020, 46(3):357-361.
[2] 杨瑞华, 潘博, 郭霞, 等. 环锭纺及转杯纺和喷气涡流纺混色纱的纤维混合效果研究[J]. 纺织学报, 2021, 42(7):76-81, 88.
YANG Ruihua, PAN Bo, GUO Xia, et al. Study on fiber mixing effect in ring spun, rotor and air-jet-vortex spun color blended yarns[J]. Journal of Textile Research, 2021, 42(7):76-81, 88.
[3] YANG Ruihua, PAN Bo, ZHANG Kanglei, et al. Stearns-Noechel color matching model of digital rotor spinning viscose melange yarn[J]. Cellulose, 2021, 28(15): 10039-10053.
doi: 10.1007/s10570-021-04167-0
[4] 王玉娟, 汪军. 原配色丝颜色预测模型[J]. 纺织学报, 2021, 42(2):156-160.
WANG Yujuan, WANG Jun. Color prediction model of compound filament[J]. Journal of Textile Research, 2021, 42(2):156-160.
[5] 马崇启, 朱宝基, 刘凤坤, 等. 基于Stearns-Noechel模型的色纺纱配色算法改进[J]. 天津工业大学学报, 2019, 38(3):41-46.
MA Chongqi, ZHU Baoji, LIU Fengkun, et al. Improvement of color matching algorithm for color spinning based on Stearns-Noechel model[J]. Journal of Tiangong University, 2019, 38(3):41-46.
[6] 马崇启, 程璐, 金晓, 等. Stearns-Noechel模型的全光谱纱线配色算法[J]. 光谱学与光谱分析, 2018, 38(8): 2488-2492.
MA Chongqi, CHENG Lu, JIN Xiao, et al. Research on all spectral yarn color matching algorithm based on Stearns-Noechel model[J]. Spectroscopy and Spectral Analysis, 2018, 38(8):2488-2492.
[7] 程璐, 陈婷婷, 曹吉强, 等. 基于光谱反射率的色纺纱计算机修色算法[J]. 纺织学报, 2020, 41(9):39-44.
CHENG Lu, CHEN Tingting, CAO Jiqiang, et al. Computer color correction algorithm for color spinning based on spectral reflectance[J]. Journal of Textile Research, 2020, 41(9):39-44.
[8] 马崇启, 程璐, 王玉娟, 等. 基于Friele模型的彩色纤维混色配方算法[J]. 纺织学报, 2017, 38(12):33-37.
MA Chongqi, CHENG Lu, WANG Yujuan, et al. Color fiber mixing formula algorithm based on Friele model[J]. Journal of Textile Research, 2017, 38(12):33-37.
[9] 杨瑞华, 韩瑞叶, 徐亚亚, 等. 数码转杯纺混色纱中有色纤维混合效果分析[J]. 纺织学报, 2018, 39(7): 32-38.
YANG Ruihua, HAN Ruiye, XU Yaya, et al. Analysis on blending effect of colored fiber in digital rotor spun yarn[J]. Journal of Textile Research, 2018, 39(7): 32-38.
[10] SHEN J, ZHOU X, MA H, et al. Spectrophotometric prediction of pre-colored fiber blends with a hybrid model based on artificial neural network and Stearns-Noechel model[J]. Textile Research Journal, 2016, 87(3): 77-80.
[11] BURLONE D A. Theoretical and practical aspects of selected fiber-blend color formulation functions[J]. Color Research and Application, 1984, 9: 213-219.
doi: 10.1002/col.5080090406
[12] 何颂华, 陈桥, 段江. 基于人眼视觉特性的光谱降维模型研究[J]. 光谱学与光谱分析, 2015, 35(6):1459-1463.
pmid: 26601347
HE Songhua, CHEN Qiao, DUAN Jiang. The research of spectral dimension redection method based on human visual characteristics[J]. Spectroscopy and Spectral Analysis, 2015, 35(6):1459-1463.
pmid: 26601347
[13] 程璐. 色纺纱配色算法改进及计算机测配色系统开发[D]. 天津: 天津工业大学, 2018:34-38.
CHENG Lu. Improvement of color matching algorithm and development of computer color matching system for color spinning[D]. Tianjin: Tiangong University, 2018:34-38.
[1] 杨柳, 李羽佳, 张鑫, 何文婧, 童胜昊, 马磊, 张毅, 张瑞云. 色纺针织物紧密程度对颜色预测的影响[J]. 纺织学报, 2022, 43(05): 104-108.
[2] 张爱丹, 郭珍妮, 汪阳子. 模块组合全显色结构提花织物设计与仿色优化比较[J]. 纺织学报, 2021, 42(10): 67-74.
[3] 许雪梅. 基于模拟退火算法改进遗传算法的织物智能配色[J]. 纺织学报, 2021, 42(07): 123-128.
[4] 袁理, 熊莹, 谷迁, 王丹书, 霍达, 刘军平. 染色纤维与色纺纱线间的颜色传递规律及其影响因素[J]. 纺织学报, 2021, 42(05): 122-129.
[5] 裘柯槟, 陈维国, 周华. 用光谱成像技术与分光光度法测量织物颜色的比较分析[J]. 纺织学报, 2020, 41(11): 73-80.
[6] 程璐, 陈婷婷, 曹吉强, 王颖, 夏鑫. 基于光谱反射率的色纺纱计算机修色算法[J]. 纺织学报, 2020, 41(09): 39-44.
[7] 应双双, 裘柯槟, 郭宇飞, 周赳, 周华. 纺织品色彩管理色表测量数据的误差优化[J]. 纺织学报, 2020, 41(08): 74-80.
[8] 张戈, 周建, 王蕾, 潘如如, 高卫东. 用分光光度计法测量纤维颜色的影响因素[J]. 纺织学报, 2020, 41(04): 72-77.
[9] 杨红英, 惠志奎, 杨志晖, 张靖晶, 谢宛姿, 周金利. 基于汉风色典的不同色差公式的色差均匀性[J]. 纺织学报, 2020, 41(02): 103-108.
[10] 张婷婷, 薛元, 贺玉东, 刘曰兴, 张国清. 环锭数码纱Kubelka-Munk双常数配色模型构建及其色彩预测[J]. 纺织学报, 2020, 41(01): 50-55.
[11] 赵博研, 赵玉珠. 光致变色纺织品的检测方法[J]. 纺织学报, 2019, 40(08): 124-129.
[12] 吴义伦, 李忠健, 潘如如, 高卫东, 张宁. 应用色纺纱图像的纬编针织物外观模拟[J]. 纺织学报, 2019, 40(06): 111-116.
[13] 黄嘉俊, 柯薇, 王静, 邓中民. 基于计算机视觉的牛仔服装色差检测评级系统[J]. 纺织学报, 2019, 40(05): 163-169.
[14] 袁理, 王丹书, 谷迁, 屠劭杰, 熊莹, 袁浩然, 刘军平, 鄢煜尘. 基于光谱泛相似测度的色纺纱线与织物间呈色规律[J]. 纺织学报, 2019, 40(02): 30-37.
[15] 刘建勇 黄烨 谭学强. 色纺纱的计算机配色研究进展[J]. 纺织学报, 2018, 39(11): 176-184.
Viewed
Full text


Abstract

Cited

  Shared   
  Discussed   
No Suggested Reading articles found!