纺织学报 ›› 2023, Vol. 44 ›› Issue (07): 141-150.doi: 10.13475/j.fzxb.20221100501
郭玉秋1,2, 钟毅1,2,3, 徐红1,2,3, 毛志平1,4,5( )
)
GUO Yuqiu1,2, ZHONG Yi1,2,3, XU Hong1,2,3, MAO Zhiping1,4,5()
摘要:
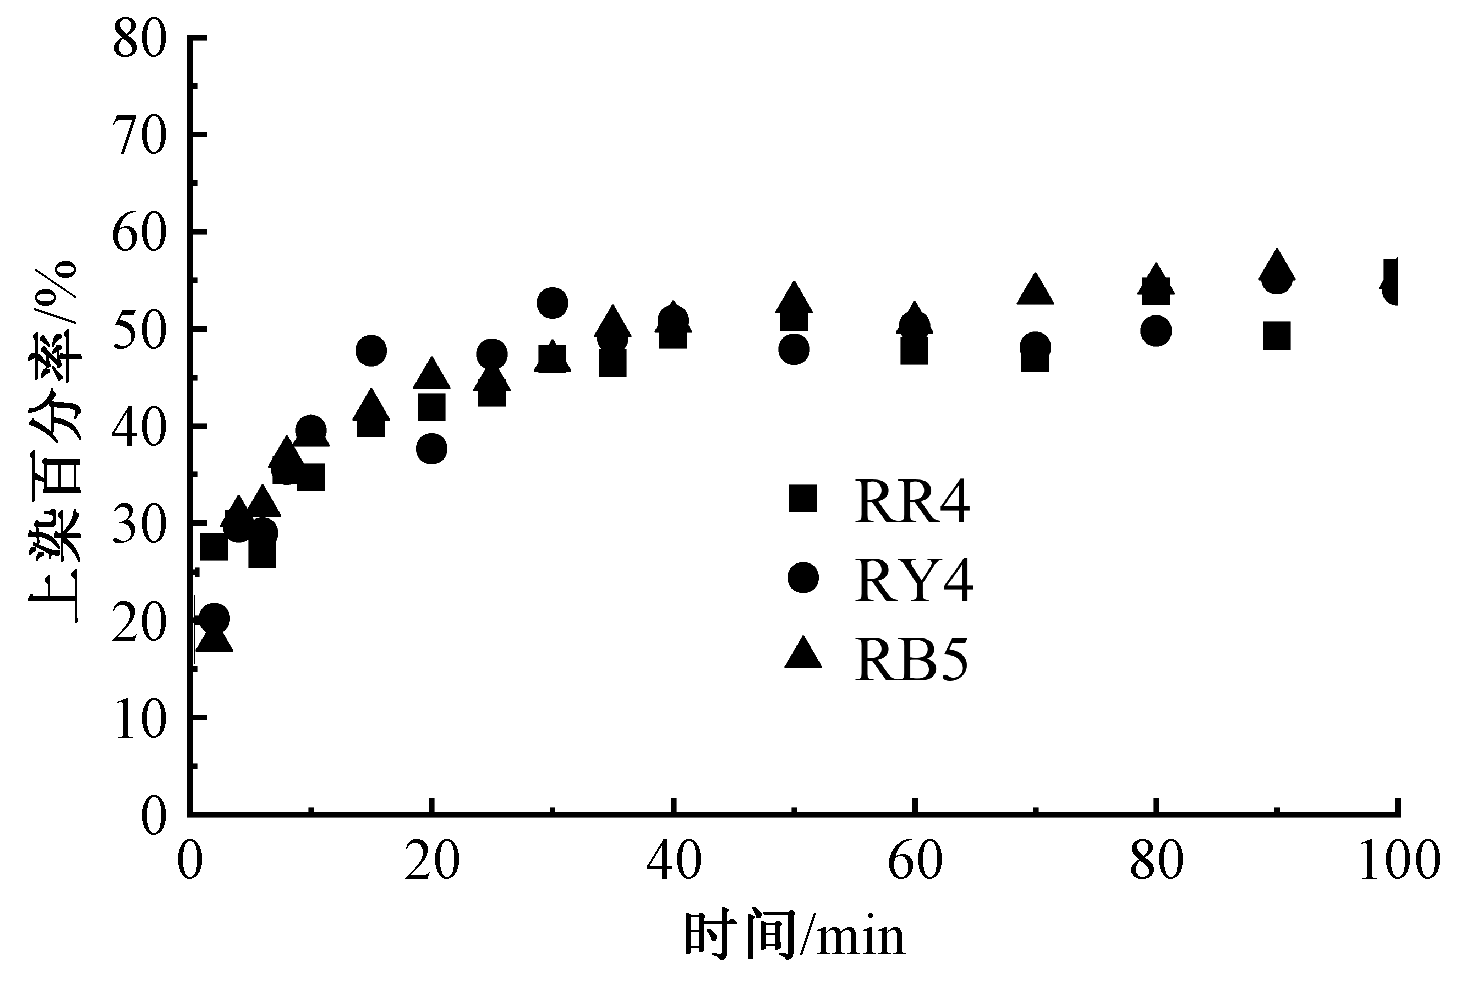
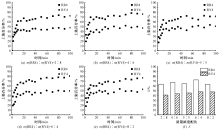
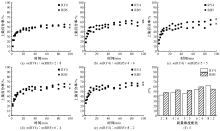
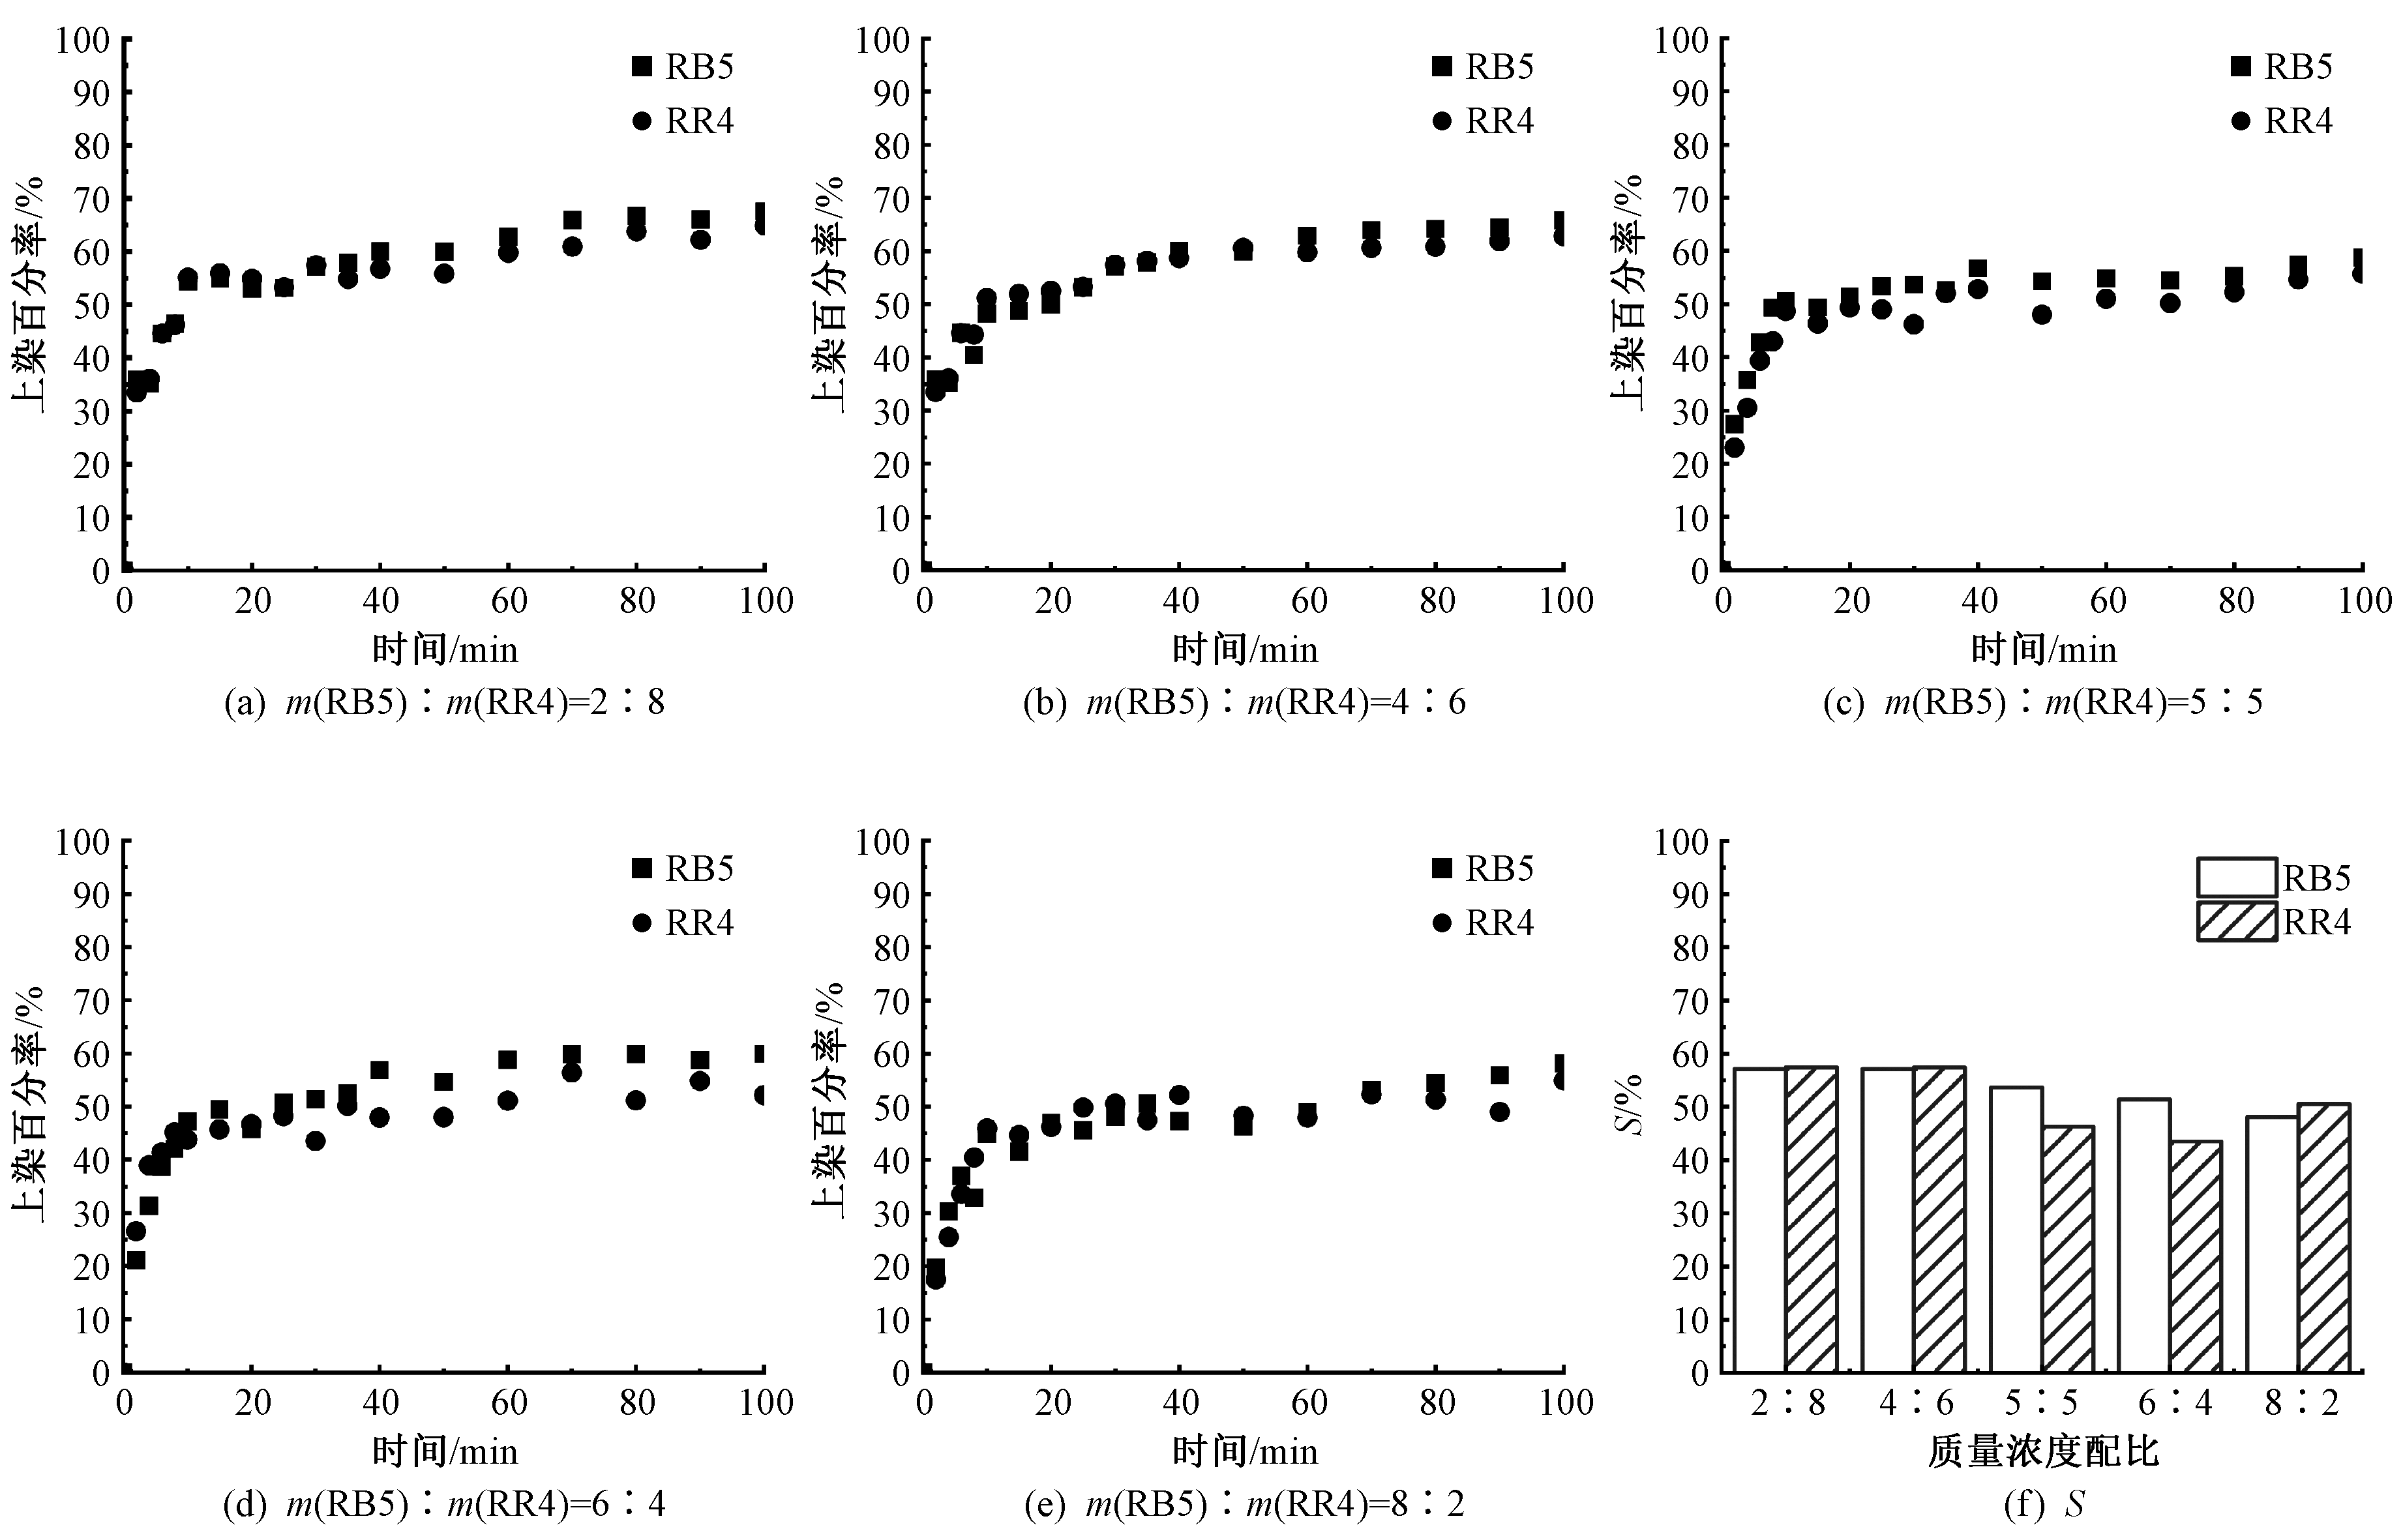
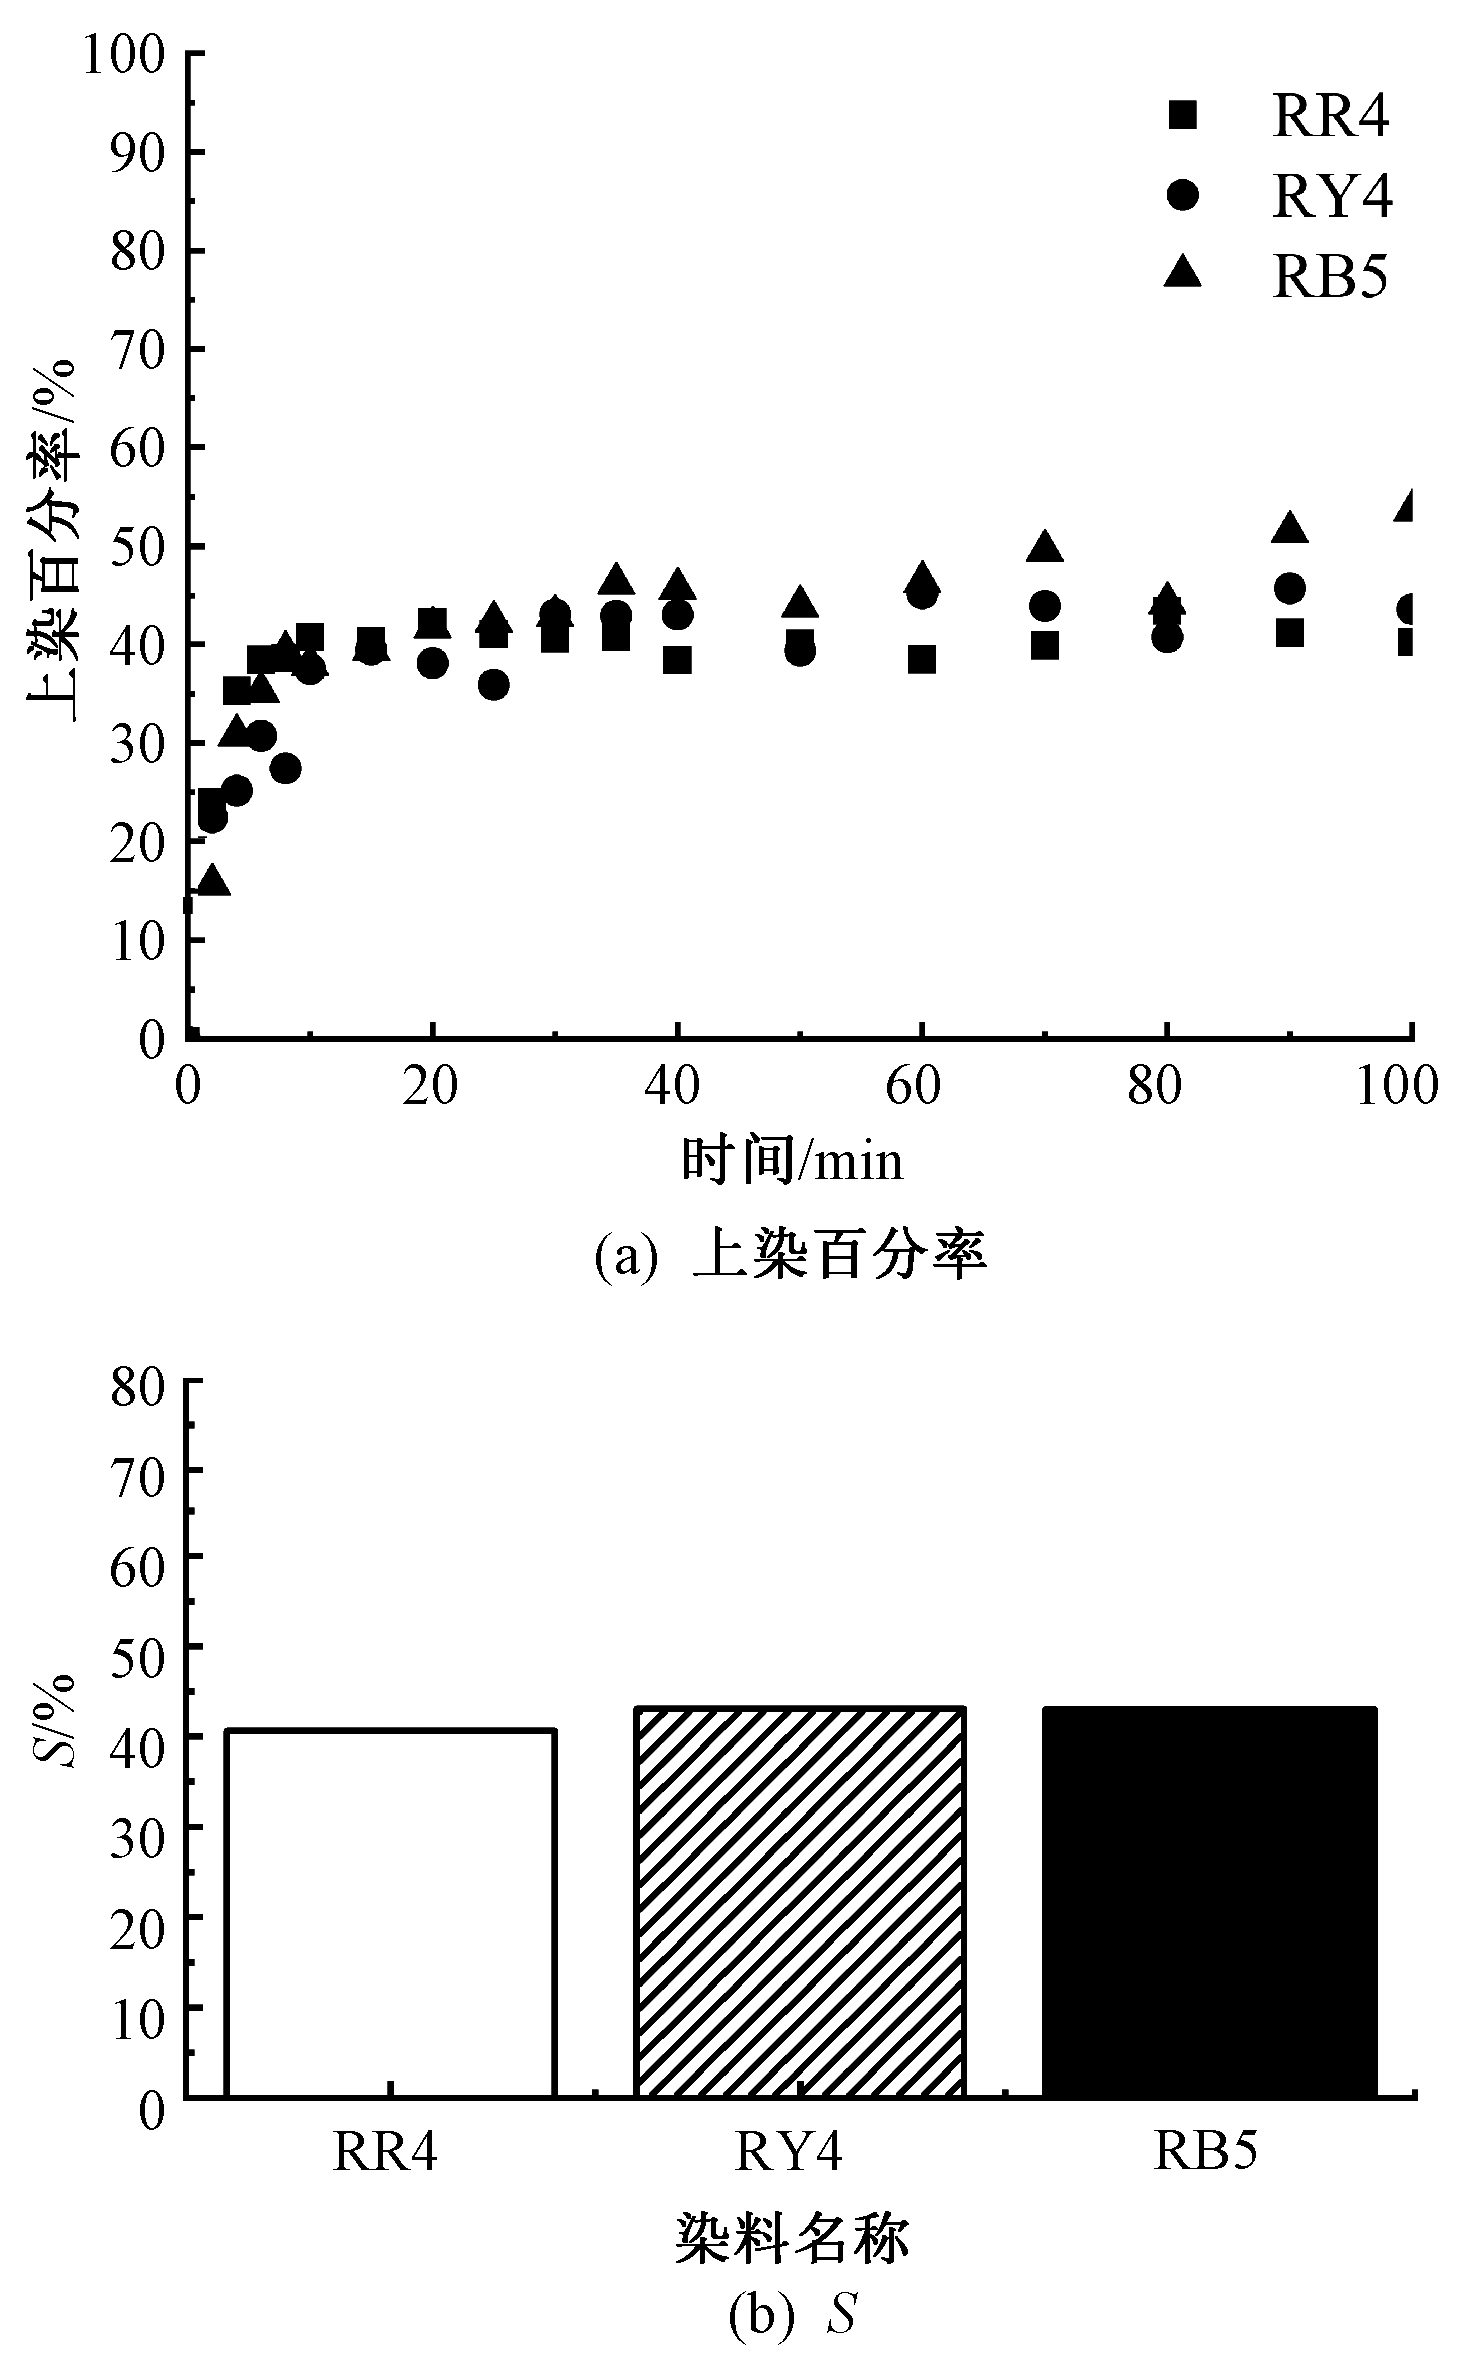
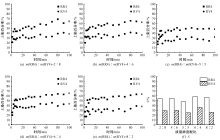
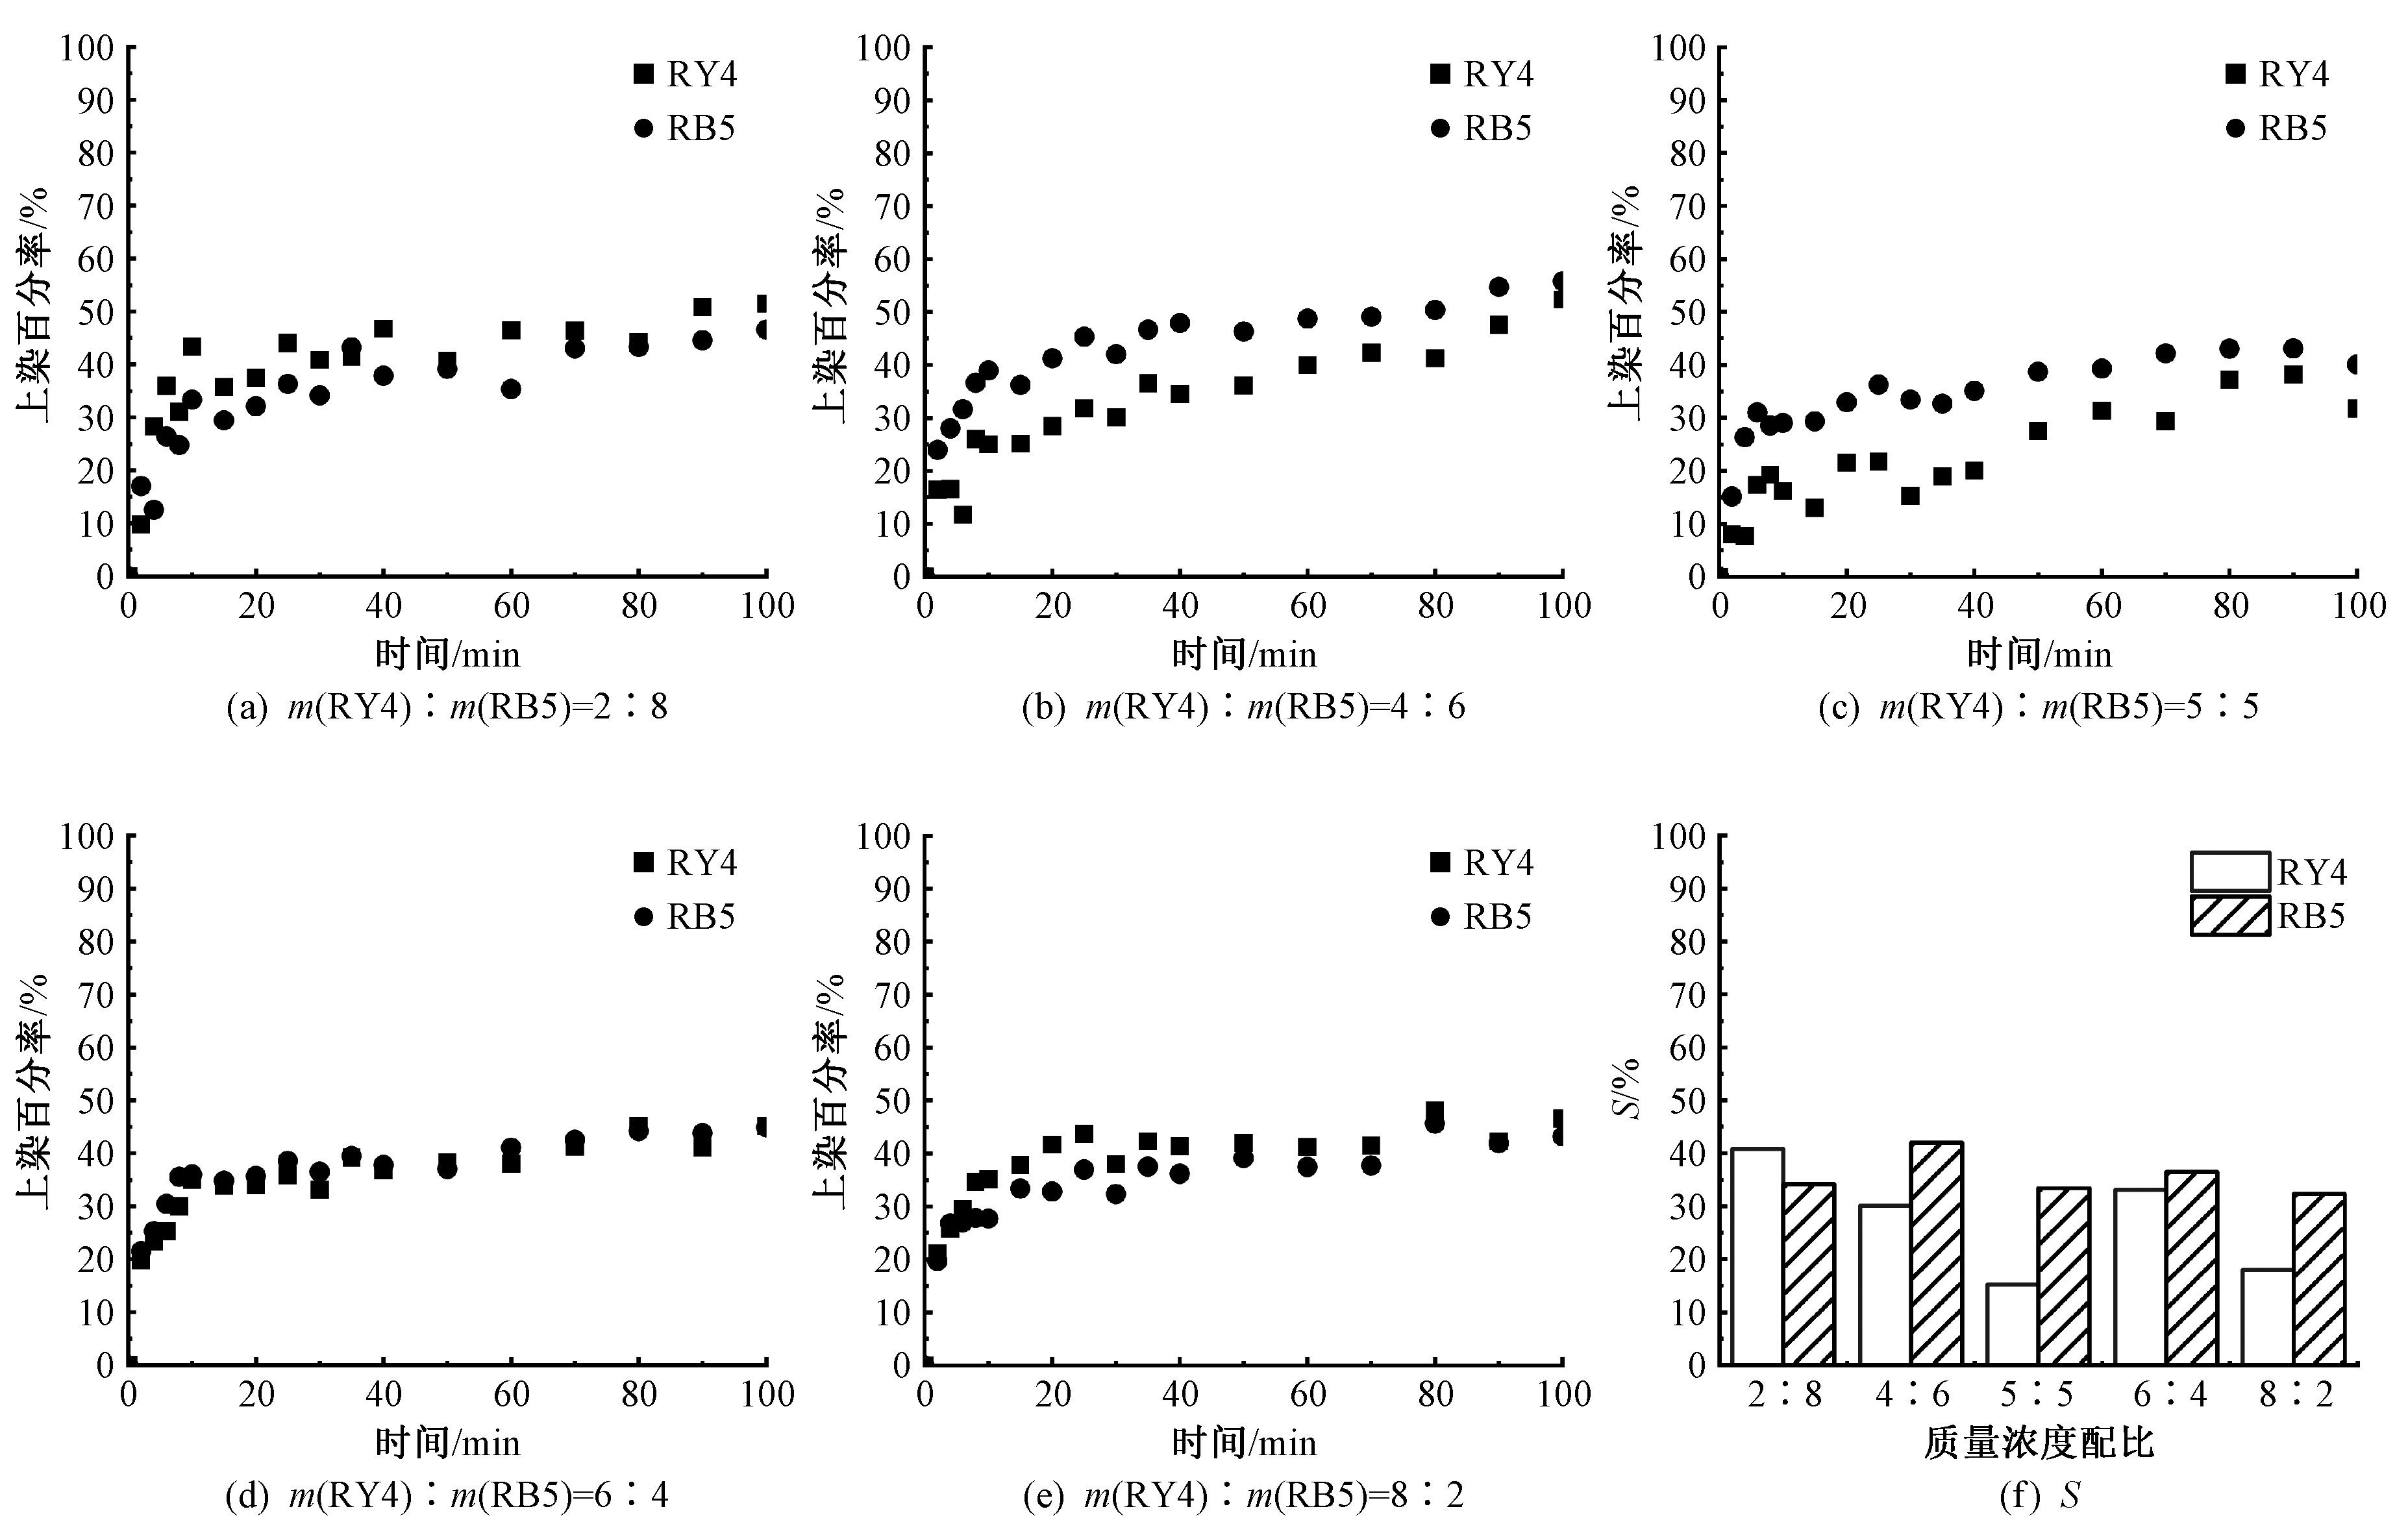
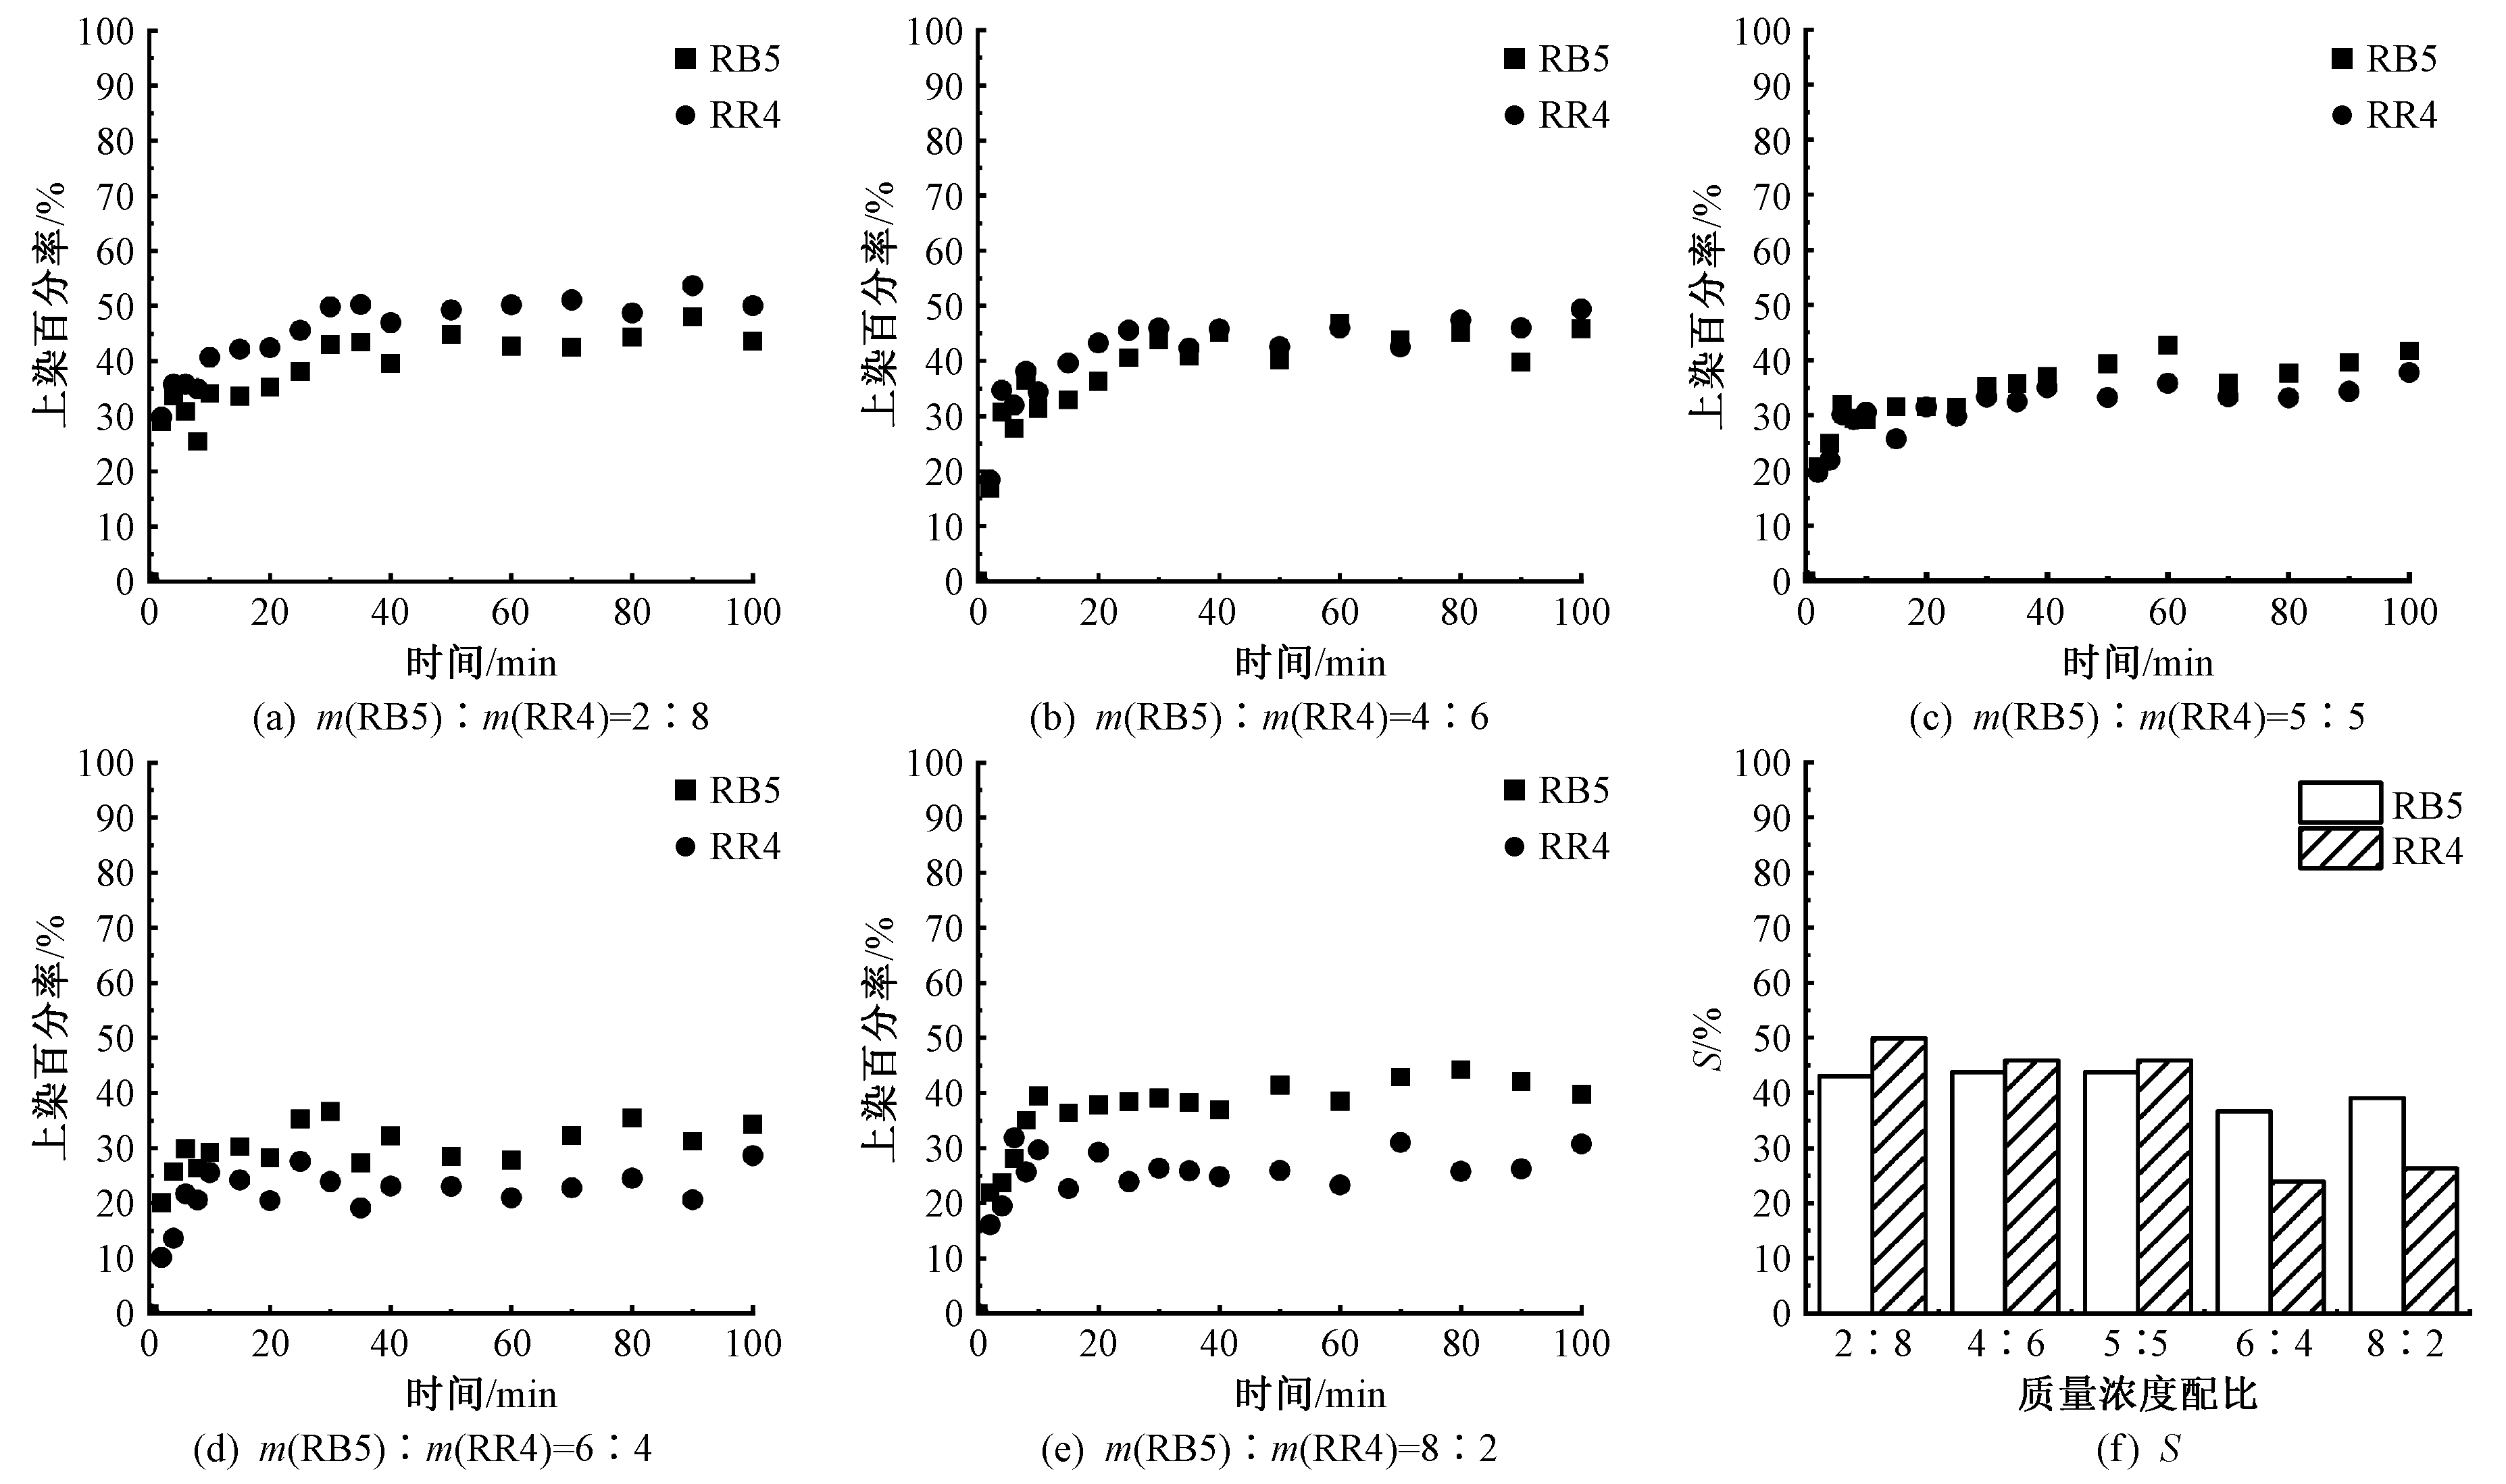
将拉曼光谱技术与化学计量法(偏最小二乘法)结合,建立了一种简便、灵敏、精确的多组分定量分析方法,可对混合液体多组分同时进行定量分析,进而有效提高织物色光稳定性和产品质量。首先根据拉曼光谱特征峰与染料质量浓度之间的线性关系测定待测组分的检测极限,确定定量成分适用的质量浓度范围;然后构建多组分混合体系定量分析模型;最后通过检测双乙烯砜活性基结构的活性染料拼混染色在吸附过程中各组分质量浓度变化和纤维上染百分率,进一步评价染料的配伍性。结果表明:模型的拟合值与标准值之间的相关系数均大于0.99,内部交互验证均方根误差和预测均方根误差值均小于0.2,通过本文方法构建的多组分定量分析模型具有较高的准确性,且拼混的染料结构和质量比会影响单一组分的上染过程。
中图分类号:
| [1] | 尹宇, 王春梅, 吴国宾. 活性染料SEFR值测试与配伍性能研究[J]. 印染, 2002, 28(3): 5-8. |
| YIN Yu, WANG Chunmei, WU Guobin. Determination of SEFR value and compatibility of reactive dyes-tuffs[J]. China Dyeing & Finishing, 2002, 28(3):5-8. | |
| [2] | 房文杰. 染液中染料组分的质量浓度分析[D]. 上海: 东华大学, 2011:1-20. |
| FANG Wenjie. Concentration analysis of dyestuffs in dye solution[D]. Shanghai: Donghua University, 2011:1-20. | |
| [3] |
WANG Xiao, ZHAO Ya, QI Xin, et al. Quantitative analysis of metabolites in the aflatoxin biosynthesis pathway for early warning of aflatoxin contamination by UHPLC-HRMS combined with QAMS[J]. Journal of Hazardous Materials, 2022.DOI: 10.1016/j.jhazmat.2022.128531.
doi: 10.1016/j.jhazmat.2022.128531 |
| [4] |
DEMETS Ruben, ROOSEN Martijn, VANDERMEERSCH Loree, et al. Development and application of an analytical method to quantify odour removal in plastic waste recycling processes[J]. Resources, Conservation and Recycling, 2020. DOI:10.1016/j.resconrec.2020.104907.
doi: 10.1016/j.resconrec.2020.104907 |
| [5] |
CHEN Qiaoli, WANG Zhirong, YANG Bin, et al. Determination of main alkylamides responsible for Zanthoxylum bungeanum pungency through quantitative analysis of multi-components by a single marker[J]. Food Chemistry, 2022. DOI: 10.1016/j.foodchem.2022.133645.
doi: 10.1016/j.foodchem.2022.133645 |
| [6] |
TANG Tian, ZHANG Pei, LI Siqi, et al. Absolute quantification of acylcarnitines using integrated Tmt-PP derivatization-based LC-MS/MS and quantitative analysis of multi-components by a single marker strategy[J]. Analytical Chemistry, 2021, 93(38):12973-12980.
doi: 10.1021/acs.analchem.1c02606 pmid: 34529423 |
| [7] |
VÍCTOR Cerdà, PIYAWAN Phansi, SERGIO Ferreira. From mono-to multicomponent methods in UV-VIS spectrophotometric and fluorimetric quantitative analysis: a review[J]. TrAC Trends in Analytical Chemistry, 2022. DOI: 10.1016/j.trac.2022.116772.
doi: 10.1016/j.trac.2022.116772 |
| [8] | 宋光均, 粟晖, 姚志湘, 等. 染液中活性染料组分的质量浓度测定[J]. 光谱实验室, 2013, 30(1):154-157. |
| SONG Guangjun, SU Hui, YAO Zhixiang, et al. Determination of concentration of reactive dyes components in dye solution[J]. Chinese Journal of Spectroscopy Laboratory, 2013, 30(1):154-157. | |
| [9] |
DAI Yamin, YANG Binfan, DING Yongsheng, et al. Real-time monitoring of multicomponent reactive dye adsorption on cotton fabrics by Raman spectroscopy[J]. Spectrochim Acta A: Mol Biomol Spectrosc, 2020.DOI: 10.1016/j.saa.2020.118051.
doi: 10.1016/j.saa.2020.118051 |
| [10] |
STOBBAERTS R F, HAVERBEKE L V, HERMAN M A. Qualitative and quantitative determination of some yellow, orange and red food dyes by resonance Raman spectroscopy[J]. Journal of Food Science, 1983, 48: 521-525.
doi: 10.1111/jfds.1983.48.issue-2 |
| [11] |
RIVAS Nicolas, ZHONG Shazhou, DEKKER Tian, et al. Generation and detection of coherent longitudinal acoustic waves in ultrathin 1T'-MoTe2[J]. Applied Physics Letters, 2019. DOI:10.1063/1.5125862.
doi: 10.1063/1.5125862 |
| [12] |
SINGH M P, MANDAL M, SETHUPATHI K, et al. Study of thermometry in two-dimensional Sb2Te3 from temperature-dependent Raman spectroscopy[J]. Nanoscale Res Lett, 2021. DOI: 10.1186/s11671-020-03463-1.
doi: 10.1186/s11671-020-03463-1 |
| [13] |
PARK J J, KIM D K, LEE S, et al. Diagnostic accuracy of Raman spectroscopy for prostate cancer: a systematic review and meta-analysis[J]. Transl Androl Urol, 2021.DOI: 10.21037/tau-20-924.
doi: 10.21037/tau-20-924 |
| [14] |
WANG Wenting, ZHANG Hua, YUAN Yuan, et al. Research progress of Raman spectroscopy in drug analysis[J]. AAPS Pharm Sci Tech, 2018. DOI: 10.1208/s12249-018-1135-8.
doi: 10.1208/s12249-018-1135-8 |
| [15] |
MAHANNA H, El-BENDARY N. Enhanced catalytic oxidation of reactive dyes by reuse of adsorption residuals as a heterogeneous catalyst with persulfate/UV process[J]. Int J Environ Sci Technol, 2022. DOI:10.1007/s13762-021-03856-4.
doi: 10.1007/s13762-021-03856-4 |
| [16] |
BYRNE H J, BEHL I, CALADO G, et al. Biomedical applications of vibrational spectroscopy: oral cancer diagnostics[J]. Spectrochim Acta A: Mol Biomol Spectrosc, 2021. DOI: 10.1016/j.saa.2021.119470.
doi: 10.1016/j.saa.2021.119470 |
| [17] | YUAN Xueyin, MAYANOVIC Robert. An empirical study on Raman peak fitting and its application to Raman quantitative research[J]. Applied Spectroscopy: Society for Applied Spectroscopy, 2017, 71(10):2325-2338. |
| [18] | 刘薇. 针对不同混合物体系的拉曼光谱解析算法研究及应用[D]. 杭州: 浙江大学, 2019:30-31. |
| LIU Wei. Study and application of Raman spectral analytical algorithms for different mixture systems[D]. Hangzhou: Zhejiang University, 2019:30-31. | |
| [19] |
MUHAMMAD Faheem, SHAGUFTA Riaz, YASIR Javed, et al. Rapid single-step synthesis and crystal structure analysis of Cu∶ZnO photocatalyst for efficient degradation of reactive dyes under UV-visible light irradiation[J]. Arabian Journal for Science and Engineering, 2022, 47(6): 7729-7745.
doi: 10.1007/s13369-022-06629-4 |
| [20] |
GAO Ying, DAI Liankui, ZHU Huadong, et al. Quantitative analysis of main components of natural gas based on Raman spectroscopy[J]. Chinese Journal of Analytical Chemistry, 2019, 47(1): 67-76.
doi: 10.1016/S1872-2040(18)61135-1 |
| [21] |
LI Yang, HUANG Yue, XIA Jingjing, et al. Quantitative analysis of honey adulteration by spectrum analysis combined with several high-level data fusion strategies[J]. Vibrational Spectroscopy, 2020. DOI: 10.1016/j.vibspec.2020.103060.
doi: 10.1016/j.vibspec.2020.103060 |
| [22] | 刘彤. 基于蚁群算法的分子光谱波长选择新方法与应用基础研究[D]. 杭州: 浙江大学, 2017:11-23. |
| LIU Tong. A new wavelengths selection method for molecular spectra based on ant colony optimization and fundamental applications[D]. Hangzhou: Zhejiang University, 2017:11-23. | |
| [23] | 赵涛. 染整工艺原理:下册[M]. 北京: 中国纺织出版社, 2009:148-151. |
| ZHAO Tao. Dyeing and finishing process principle: volume II[M]. Beijing: China Textile & Apparel Press, 2009:148-151. |
| [1] | 陈家辉, 梁跃耀, 陈妮, 房宽峻. 棉织物喷墨印花打印方式的调控及其应用[J]. 纺织学报, 2023, 44(07): 159-166. |
| [2] | 谭家玲, 刘佳音, 于伟东, 殷允杰, 王潮霞. 基于SiO2微胶囊的多色谱温敏变色棉织物制备及其性能[J]. 纺织学报, 2023, 44(07): 167-174. |
| [3] | 王伟, 吴嘉欣, 张晓云, 张传杰, 宫兆庆. 制浆用废旧棉织物的脱色性能及其机制[J]. 纺织学报, 2023, 44(07): 175-183. |
| [4] | 吴伟, 纪柏林, 毛志平. 活性及分散染料染色新技术[J]. 纺织学报, 2023, 44(05): 1-12. |
| [5] | 胡安钟, 王成成, 钟子恒, 张丽平, 付少海. 氮化硼纳米片掺杂型快速响应温致变色织物的制备及其性能[J]. 纺织学报, 2023, 44(05): 164-170. |
| [6] | 王小艳, 马子婷, 许长海. 基于高耐碱高耐氧漂分散染料的涤盖棉织物漂染一浴加工工艺[J]. 纺织学报, 2023, 44(05): 38-45. |
| [7] | 齐浩彤, 张林森, 侯秀良, 徐荷澜. 废食用油-水无盐体系活性染色棉织物的服用性能[J]. 纺织学报, 2023, 44(03): 126-131. |
| [8] | 王金坤, 刘秀明, 房宽峻, 乔曦冉, 张帅, 刘冬冬. 双乙烯砜基团活性染料染色对棉织物防皱性能的提升[J]. 纺织学报, 2023, 44(02): 207-213. |
| [9] | 丁娟, 刘阳, 张晓飞, 郝克倩, 宗蒙, 孔雀. Fe/C多孔碳材料制备及其涂层棉织物的吸波性能[J]. 纺织学报, 2023, 44(02): 191-198. |
| [10] | 曲连艺, 刘江龙, 徐英俊, 王玉忠. 仿贻贝型耐久抗菌织物的制备及其性能[J]. 纺织学报, 2023, 44(02): 176-183. |
| [11] | 蒋琦, 刘云, 朱平. 茶多酚基阻燃/防紫外线棉织物的制备及其性能[J]. 纺织学报, 2023, 44(02): 222-229. |
| [12] | 张帅, 房宽峻, 刘秀明, 乔曦冉. 活性染料结构对彩色聚合物纳米球性能的影响[J]. 纺织学报, 2022, 43(12): 96-101. |
| [13] | 乔曦冉, 房宽峻, 刘秀明, 巩继贤, 张帅, 张敏. 羟乙基甲基纤维素改性对棉和锦纶织物表面性质的差异性影响[J]. 纺织学报, 2022, 43(11): 127-132. |
| [14] | 邵敏, 王丽君, 李美琪, 刘今强, 邵建中. 非水介质-微水体系中活性染料的水解和键合性能[J]. 纺织学报, 2022, 43(11): 94-103. |
| [15] | 张典典, 于梦楠, 李敏, 刘明明, 付少海. 基于聚合物微球接枝硅油的超滑棉织物制备及其防污性能[J]. 纺织学报, 2022, 43(10): 119-125. |
|
||
 京公网安备11010502044800号